Stellar (XLM/USD) Continues Soaring to New Heights in November
Estimated Reading Time: 3 minutes
Don’t invest unless you’re prepared to lose all the money you invest. This is a high-risk investment and you are unlikely to be protected if something goes wrong. Take 2 minutes to learn more
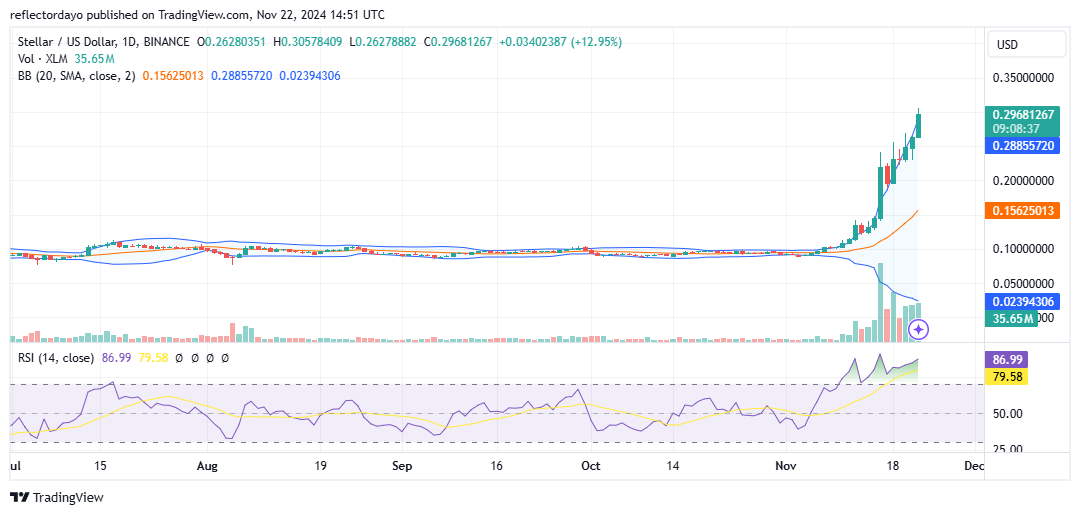
Stellar (XLM) has continued its impressive rally in November, reaching new heights. Recently, the bullish market faced resistance at the $0.25 level, where a clash between optimistic and pessimistic market sentiments heightened volatility. Despite this, the bulls maintained control, driving the price higher.
Currently, bullish momentum is pushing the market toward the critical $0.30 price level, where another significant resistance lies. However, strong fundamentals could potentially offset the expected profit-taking at this level, allowing the bullish trend to persist.
Stellar Market Data
- XLM/USD Price Now: $0.29
- XLM/USD Market Cap: $8.9 billion
- XLM/USD Circulating Supply: 30 billion
- XLM/USD Total Supply: 50 billion
- XLM/USD CoinMarketCap Ranking: #18
Key Levels
- Resistance: $0.30, $0.35, and $0.40
- Support: $0.20, $0.15., and $0.12.
Stellar Market Through the Lens of Indicators
Analyzing the daily chart over an extended period reveals that the market has remained relatively stable around the $0.10 price level for quite some time. This prolonged stability could explain why Stellar traders may be inclined to take profits at major resistance levels. Despite the significant bullish price surge, which often leads to a corresponding bearish correction, the underlying bullish momentum driving the market appears exceptionally strong. This strength likely contributed to the market breaking past the $0.25 resistance level.
While the current bullish trend remains robust, technical indicators suggest the potential for overbought conditions. The Relative Strength Index (RSI) continues to linger in overbought territory, signaling that a price correction may be imminent. This situation increases the risk for new traders entering bullish positions at this stage. A prudent approach would be to wait for the market to establish a new higher support level before considering an entry.
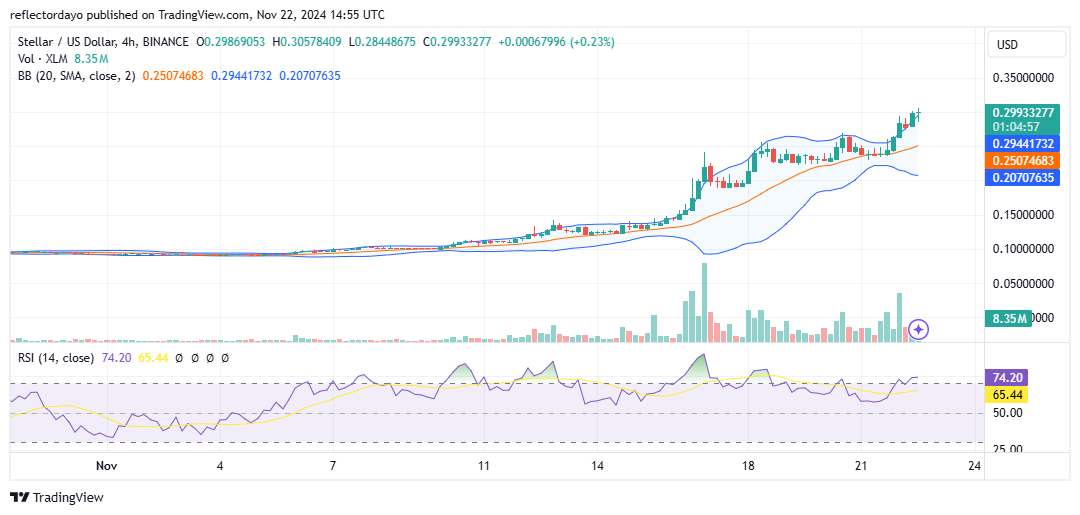
XLM/USD Price Prediction: 4-Hour Chart Analysis
The most recent candlestick on the chart resembles a cross, indicating significant trading activity during the current 4-hour session. However, neither buyers nor sellers have managed to gain decisive control of the market. This type of candlestick often signals indecision and, at this point in the crypto market, suggests a potential reversal if similar patterns persist in subsequent sessions.
If the bulls sustain their momentum, the upward trend could continue. However, if bullish momentum weakens, the $0.25 level—previously a resistance—may now act as a support level. This critical price point could provide a foundation for the market’s next move.