Band Protocol (BANDUSD) Fails to Break $7.000 Despite Decent Run
Estimated Reading Time: 3 minutes
Don’t invest unless you’re prepared to lose all the money you invest. This is a high-risk investment and you are unlikely to be protected if something goes wrong. Take 2 minutes to learn more
Market Analysis – BANDUSD Decent Run Has Failed to Break $7.000
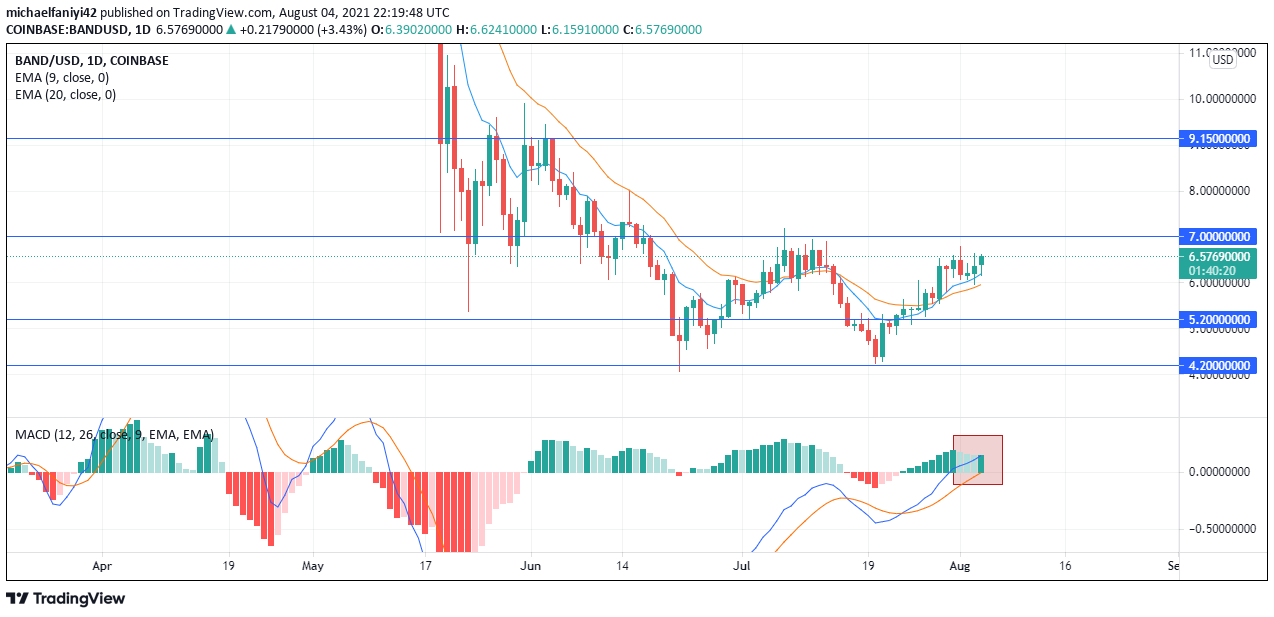
Despite BANDUSD decent run in the preceding days leading up to now, the coin has failed to break through the $7.000 price mark. A level that has proven to be vital to the bears on the chart. BANDUSD started its decent run on the 21st of July after the price reacted to the $4.200 level when buyers found support there and came into the market and pushed the coin’s dollar value 55% higher from there.
Key Levels
Resistance Levels: $7.000, $9.150
Support Levels: $4.200, $5.800
Observing the daily chart with the MACD indicator, it can be noticed that the MACD histogram, which shows the volume behind price moves, appears to be reducing. During the last four days of the period of writing, the MACD histogram has consistently appeared in a lighter color, indicating that the volume of buyers in the market has been reduced as the price approached $7.000 resistance. Hence, the bulls’ strength on the coin seems feeble at this point and unlikely to persist.
Also, based on previous price action on the chart, we observe that whenever the MACD Histogram volume dwindles, the price most times changes its preceding direction. The bulls thus seem to have their work cut out for them at the $7.000 price point, as they have failed in recent days to break through this level, despite having a decent run up so far and multiple days of trying.

Market Prospects
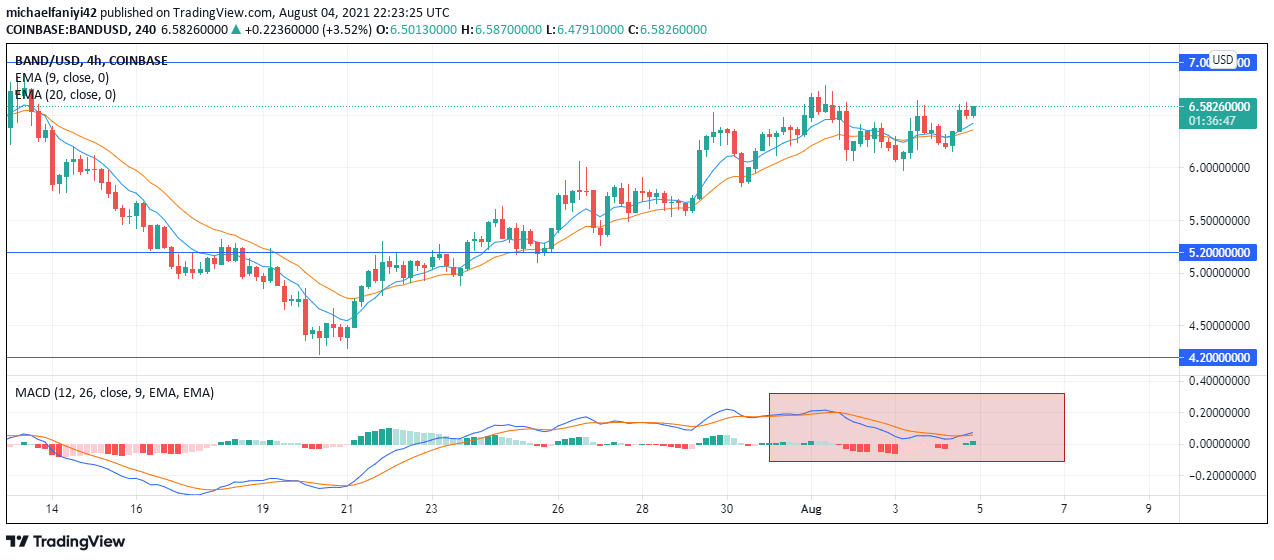
On the 4-hour chart, the market appears bullish but seems to be in a sort of consolidating mood. No definite market structure movement has been created since price last attempted to break the $7.000 resistance area. We could, therefore, in recent days, see a downtrend begin as the EMAs 9 and 20 days (Exponential Moving Average) appear to be consolidating now after having crossed each other multiple times. Perhaps this indicates the bears are trying to work their way back into the market.
If the $7.000 resistance area holds and the bears renew their dominance in the market, we could see the price continue its downtrend and make a move to break the new support level at $4.200. Should BANDUSD, however, pass the resistance test at $7.000, then the bulls could continue the decent run up and drive the price to $9.150, which is another interesting resistance level on the chart.
You can purchase crypto coins here: Buy Tokens
Note: Cryptosignal.org is not a financial advisor. Do your research before investing your funds in any financial asset or presented product or event. We are not responsible for your investing results.