Polygon (MATIC) Crushes the $1.3 Resistance, and the Price Is Now Above $1.4
Estimated Reading Time: 2 minutes
Don’t invest unless you’re prepared to lose all the money you invest. This is a high-risk investment and you are unlikely to be protected if something goes wrong. Take 2 minutes to learn more
The Polygon market encountered numerous resistance levels on its way to the upside, but it was able to keep the price channel moving upward. At each of the points where they encountered resistance, the bulls were able to maintain the support levels above the 20-day moving average.
MATIC/USD Price Statistic
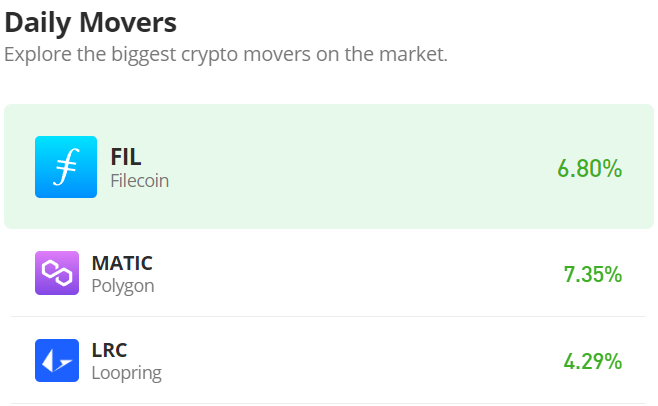
- MATIC/USD price now: $1.39
- MATIC/USD market cap: $12,195,151,274
- MATIC/USD circulating supply: 8,734,317,475 MATIC
- MATIC/USD total supply: 10,000,000,000
- MATIC/USD coin market cap rank: #9
Key Levels
- Resistance: $1.5, $1.6, $1.7
- Support: $1.0, $0.5, $0.1
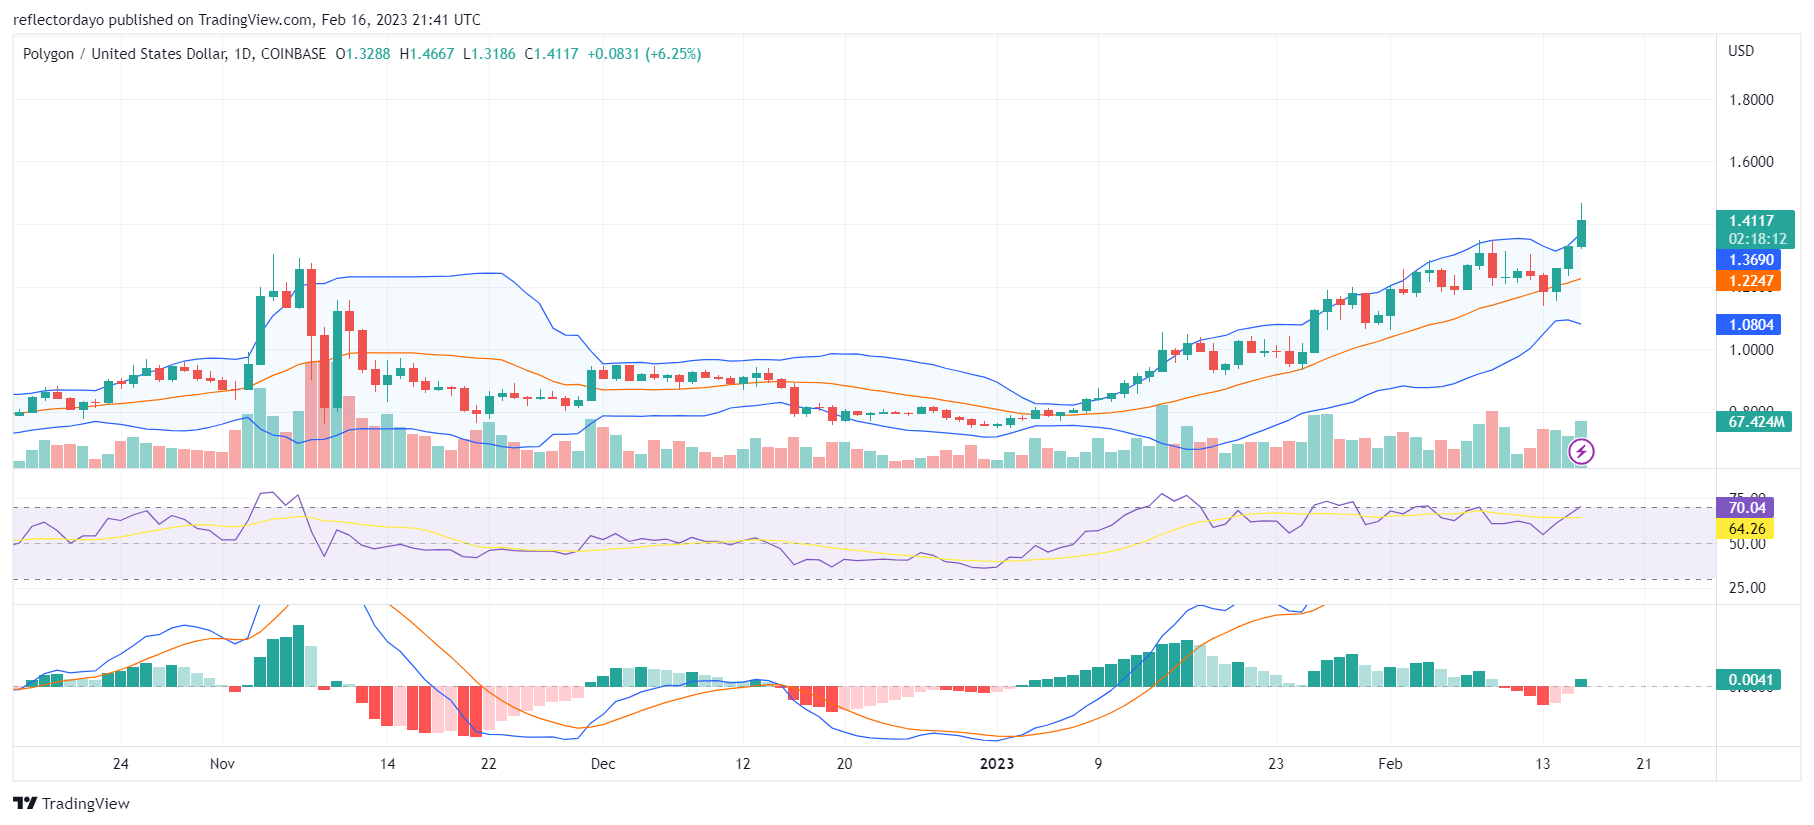
Price Prediction for Polygon: The Indicators’ Point of View
On February 8, the bull market encountered a strong resistance level at $1.3, and the bullish price got rejected at that point. This time around, the polygon bull market was able to salvage the price at the $1.19 price level, which is slightly below the 20-day moving average. At this point in the market, the Bollinger Bands indicator shows a sign of a possible change in the trend. The two bands contracted. The force behind the bullish trend is powerful; we see the price springing up again, breaking the $1.4 price level. To establish a bullish position in this new price zone, the bulls need to keep the market going in the next daily session.
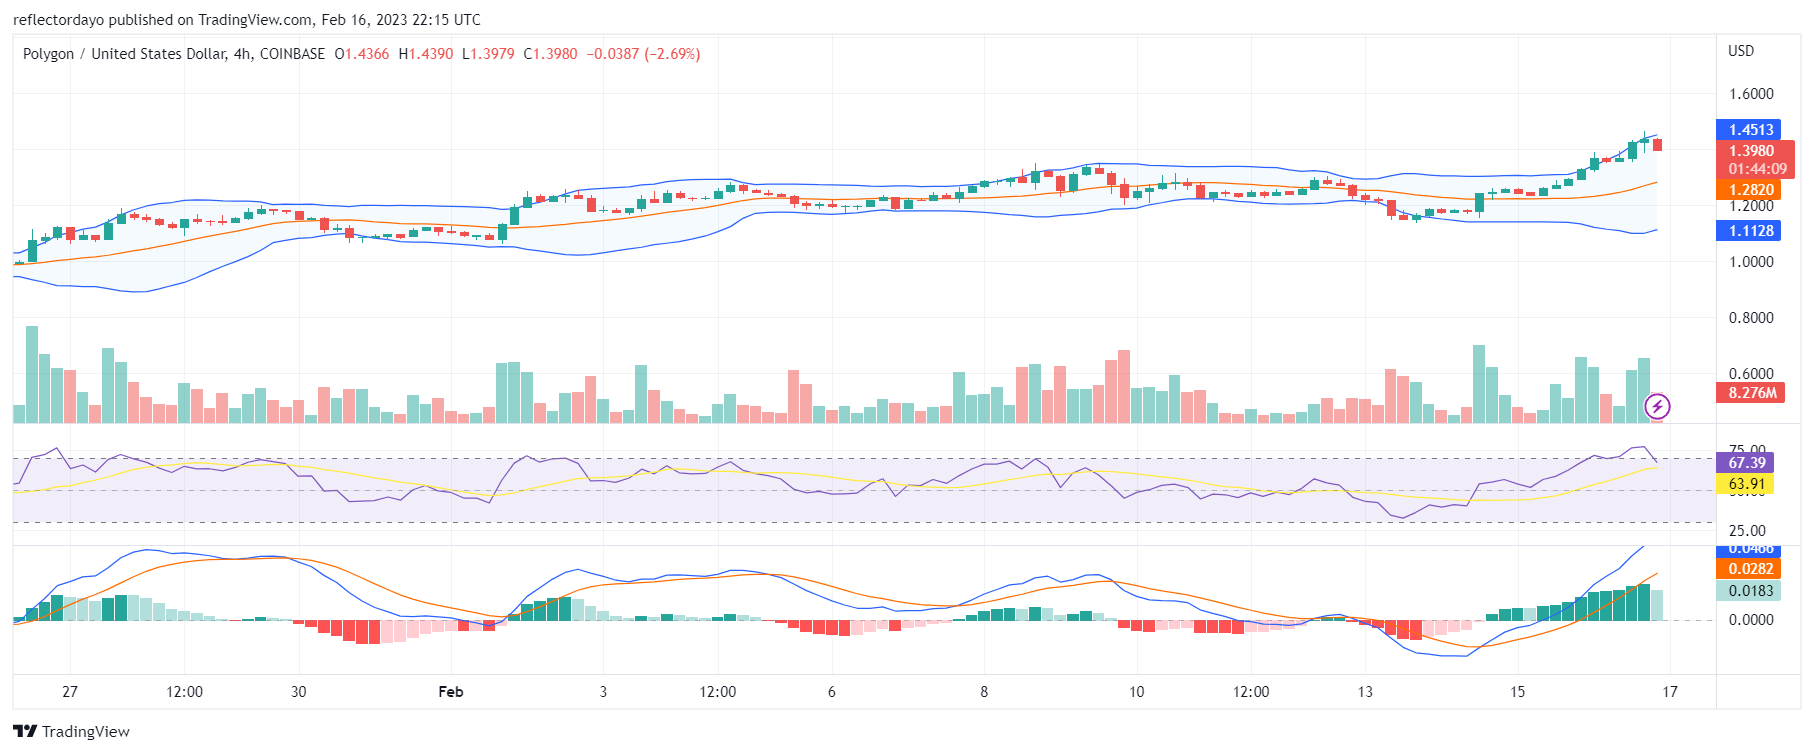
MATIC/USD 4-Hour Chart Outlook
Looking at the market from this point of view, it is likely that the trend reverse. A spinning top candlestick pattern has formed at the $1.44 resistance. The bulls are becoming exhausted and the bears appear to be gathering momentum. However, the bullish price is still a long way from crossing into bear territory, which is why the Bollinger bands indicator remains bullish.