Arbitrum Price Prediction: ARB/USD Dives Below $0.80 Support
Estimated Reading Time: 3 minutes
Don’t invest unless you’re prepared to lose all the money you invest. This is a high-risk investment and you are unlikely to be protected if something goes wrong. Take 2 minutes to learn more
Arbitrum Price Prediction – September 11
The Arbitrum price failed to cross above the resistance level of $0.84. As a result, ARB begins a fresh decline below the $0.80 support.
ARB/USD Long-term Trend: Bearish (Daily Chart)
Key levels:
Resistance Levels: $1.00, $1.10, $1.20
Support Levels: $0.55, $0.45, $0.35
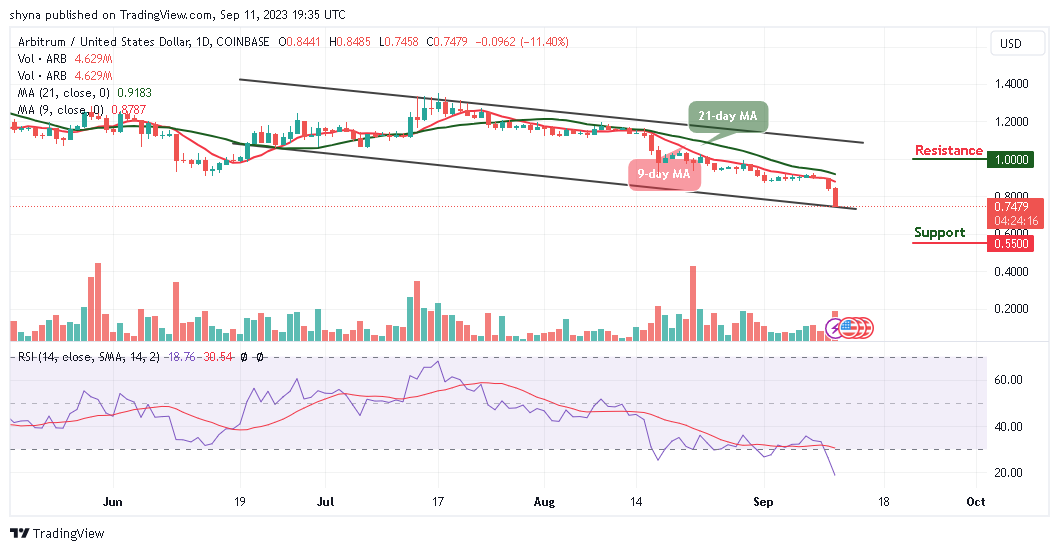
ARB/USD has dumped to its lowest level in the past few months as more selling pressure has mounted. Today’s trading session has seen the Arbitrum price tumbled below $0.80 for the first time since June. Therefore, the coin hit a low of $0.74 a couple of hours ago.
Arbitrum Price Prediction: ARB Price Could see a Further Drop
The Arbitrum price may continue to follow a bearish fever if the sellers increase the pressure. However, with the Arbitrum price heading toward the south, the coin may likely create another support at $0.70. Meanwhile, the crypto market is experiencing a serious downtrend as the 9-day moving average remains below the 21-day moving average. On the other hand, if the Arbitrum price crosses above the moving average, it could locate the potential resistance at $1.00, $1.10, and $1.20 levels.
Nevertheless, the Arbitrum price was rejected at the important level of $0.84, however, with $0.90 as the new psychological barrier to the bull run, any movement below it is a bear territory, and bulls will need to stay on their toes. However, if a deeper correction follows here, it could be considered extremely unhealthy for ARB/USD as the critical supports are located at $0.55, $0.45, and $0.35. The technical indicator Relative Strength Index (14) is now within the oversold region to confirm the bearish trend.
ARB/USD Medium-term Trend: Bearish (4H Chart)
Looking at the 4-hour chart, ARB/USD is seen on a downward move and the coin may continue to depreciate if the $0.75 support is broken. However, the 9-day moving average remains below the 21-day moving average and the Arbitrum price may continue to fall and could reach the critical support at $0.65 and below.
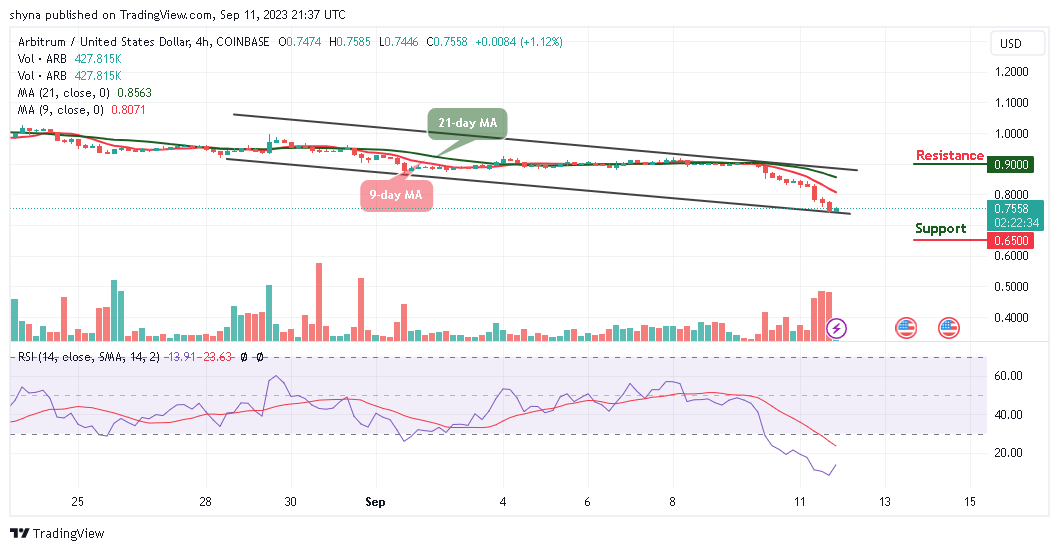
Meanwhile, if the bulls can hold the current price tight, ARB/USD may likely cross above the moving averages to hit the potential resistance at $0.90 and above. The Relative Strength Index (14) is now moving within the oversold zone, indicating more bearish signals are likely to play out.
Place winning Arbitrum trades with us. Get ARB here