Arbitrum Price Prediction: ARB/USD Price Dips Below $1.00 Level
Estimated Reading Time: 3 minutes
Don’t invest unless you’re prepared to lose all the money you invest. This is a high-risk investment and you are unlikely to be protected if something goes wrong. Take 2 minutes to learn more
Arbitrum Price Prediction – August 30
The Arbitrum price prediction reveals that ARB is seen hovering below the moving averages as the coin trades at the $0.94 support level.
ARB/USD Long-term Trend: Ranging (Daily Chart)
Key Levels:
Resistance levels: $1.20, $1.30, $1.40
Support levels: $0.75, $0.65, $0.55
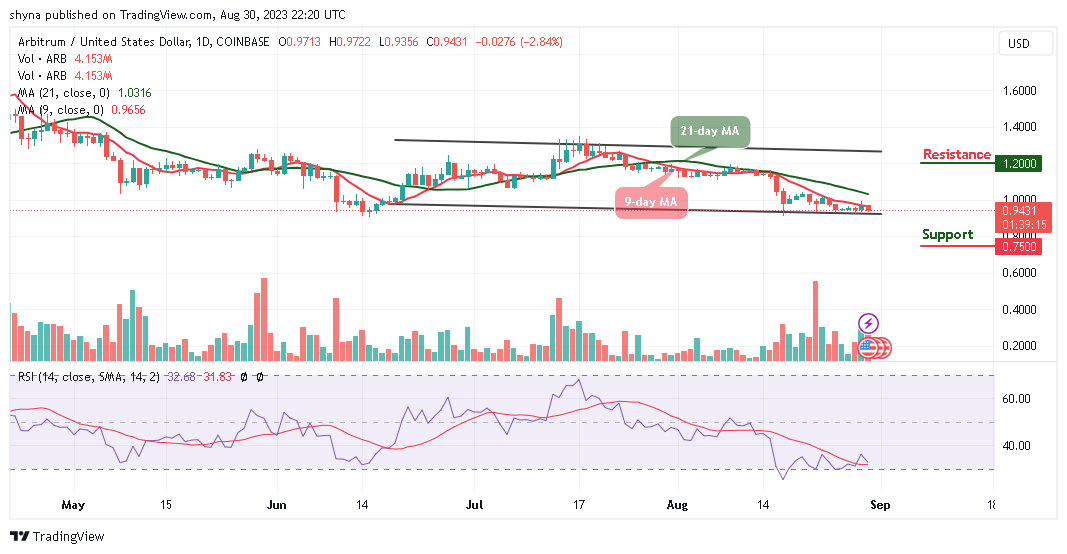
At the opening of today’s market, ARB/USD bulls were rejected around the $0.97 level as the coin dropped toward the support level of $0.90. The price is sliding below the 9-day and 21-day moving averages while the technical indicator Relative Strength Index (14) indicates increasing bearish momentum, suggesting that the market sentiment is presently bearish.
Arbitrum Price Prediction: ARB Price May Drop More
At the time of writing, the Arbitrum price is changing hands at $0.94 where it faces down, but if the Arbitrum price rises and trades above the 9-day and 21-day moving averages, the coin may begin its upward movement to retest the previous high. Moreover, the nearest resistance levels could be found at $1.20, $1.30, and $1.40 while crossing below the lower boundary of the channel could hit the support levels at $0.75, $0.65, and $0.55 respectively giving a low trading volume.
ARB/USD Medium-term Trend: Bearish (4H Chart)
According to the 4-hour chart, the Arbitrum price hovers below the 9-day and 21-day moving averages as the coin continues the bearish run. However, the next support level may come at $0.92, which could then locate further key support at $0.90 and below if the sell-off later becomes huge.
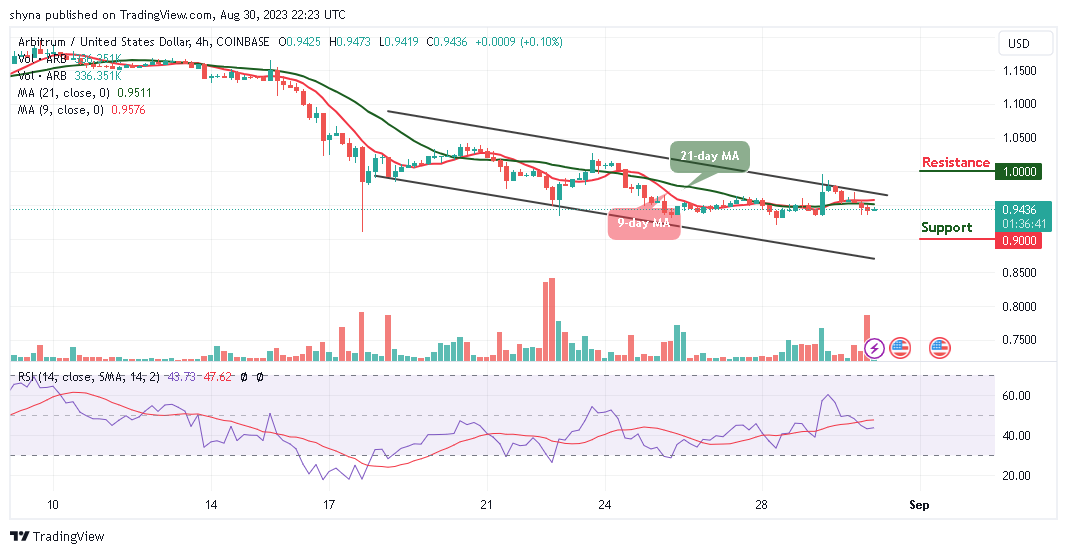
On the upside, if the bulls gather enough momentum and push the Arbitrum price above the upper boundary of the channel; ARB/USD could locate the potential resistance level of $0.98. Any further bullish movement above this level may hit the resistance level of $1.00 and above while the signal line of the technical indicator Relative Strength Index (14) moves above the 40-level, suggesting more bullish signals into the market.
Place winning Arbitrum trades with us. Get ARB here