BNB Halts at the $255 High as It Resumes Its Horizontal Trend
Estimated Reading Time: 2 minutes
Don’t invest unless you’re prepared to lose all the money you invest. This is a high-risk investment and you are unlikely to be protected if something goes wrong. Take 2 minutes to learn more

BNB (BNB) Long-Term Analysis: Bullish
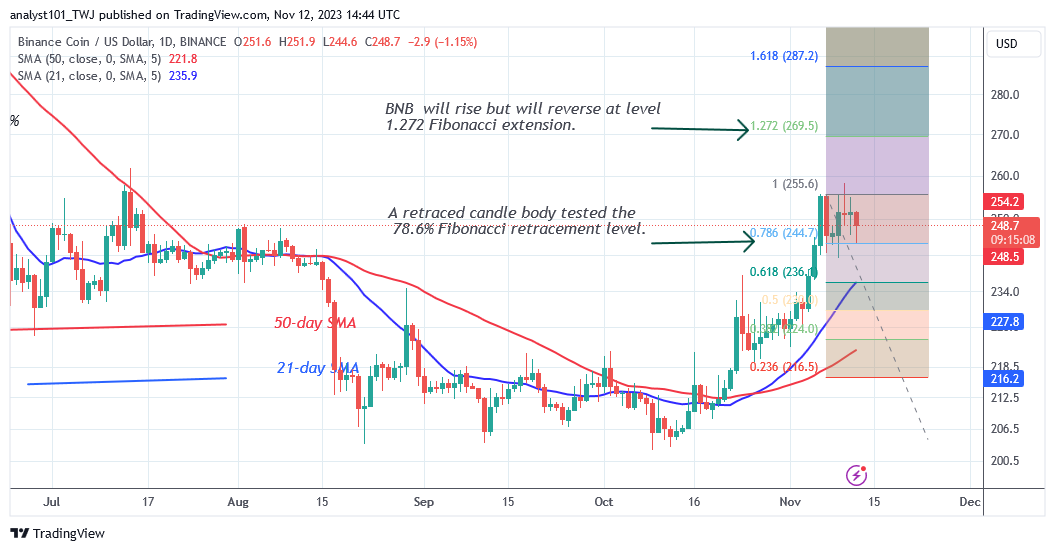
The price of BNB (BNB) has remained consistent above the $244 price level as it resumes its horizontal trend. Since November 6, the current upswing has been halted around the $255 barrier level. Buyers tested the resistance level four times and were each time rebuffed. The cryptocurrency’s pricing is now constrained to a range of $243 to $256.
The presence of Doji candlesticks has currently restrained price movement. At the time of writing, BNB is trading at $249. If the current barrier is broken, the altcoin has the potential to reach level 1.272 Fibonacci extension or $269. At that level, BNB/USD will reverse. However, if the altcoin reaches a high of $310, it will meet significant opposition.
On the downside, if BNB falls below the moving average lines or the $235 support level, the present rally will be over.
Technical indicators:
Major Resistance Levels – $440, $460, $480
Major Support Levels – $240, $220, $200
BNB (BNB) Indicator Analysis
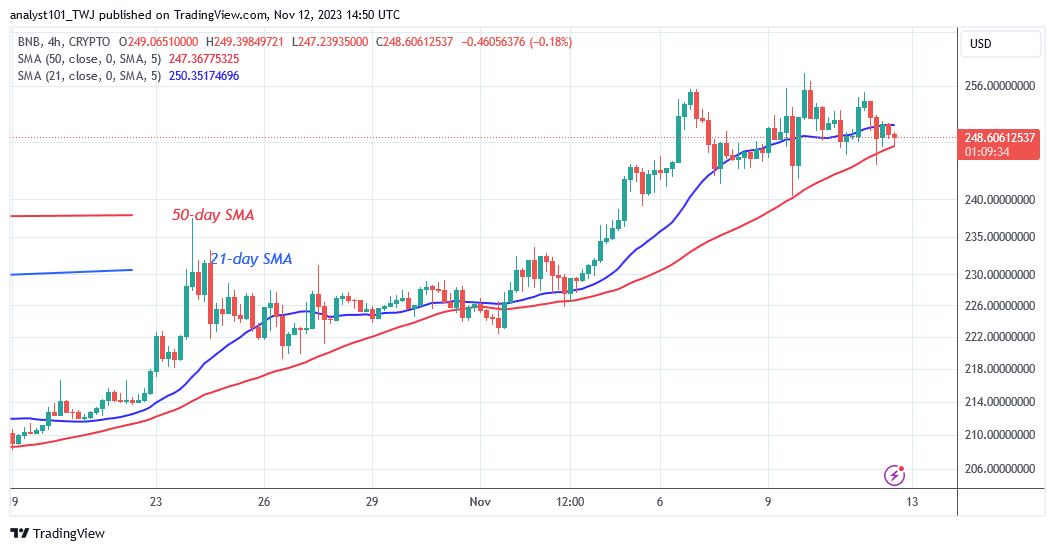
BNB has resumed a sideways trend as buyers failed to break through the $255 resistance level. The cryptocurrency’s price has retraced below the 21-day SMA but above the 50-day SMA on the 4-hour chart. The horizontal trend will continue as long as the crypto’s price is trapped between the moving average lines.
What Is the Next Direction for BNB (BNB)?
BNB/USD has been trading sideways for the past week as it resumes its horizontal trend. The current range-bound trend will continue if the levels of resistance and support remain unchanged. BNB is expected to rise since the price bars in the longer time frame are above the moving average.
You can purchase crypto coins here. Buy LBLOCK
Note: Cryptosignals.org is not a financial advisor. Do your research before investing your funds in any financial asset or presented product or event. We are not responsible for your investing results