Uniswap (UNI/USD) Price Fluctuates, Bottoming on $4 Support
Estimated Reading Time: 3 minutes
Don’t invest unless you’re prepared to lose all the money you invest. This is a high-risk investment and you are unlikely to be protected if something goes wrong. Take 2 minutes to learn more
Uniswap Price Prediction – October 12
It has been established that a line of ups and downs has been put underneath the resistance line of $4.50, given that the UNI/USD market fluctuates, bottoming on $4 support.
Due to the reduced pressing force in the movements directly above the $4 support line, several moves have been made southward. Given the circumstances, we believe that whatever forces are applied to the downside will serve to reverse the upward movement. In the long run, it can take some time before bulls start to reclaim their positions.
UNI/USD Market
Key Levels:
Resistance levels: $4.50, $5, $5.50
Support levels: $4, $3.50, $3
UNI/USD – Daily Chart
The UNI/USD daily chart reveals that the crypto-economic price fluctuates, bottoming on the $4 support line.
The Bollinger Bands at the upper line are at $4.5778173, the middle part is at $4.3146110, and the lower part is at $4.0514047. The stochastic oscillators have penetrated the oversold region, touching a critical spot to denote a signal against seeing further free fall-offs from the bargaining arena that the price is currently in. At a glance, the next upsurge value in the candlestick formation will be to serve bullish-like candlesticks.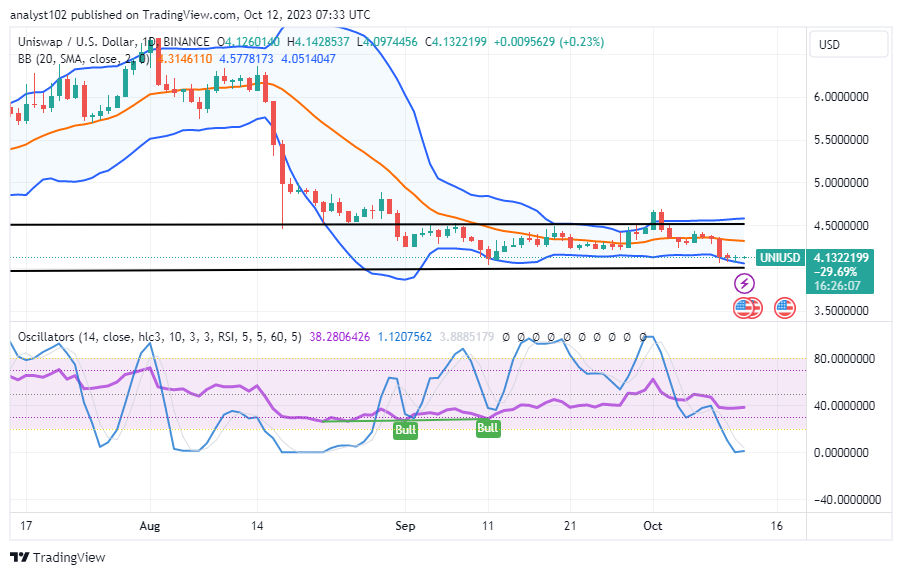
Will the critical underlying support of $4 be more easily breached by the UNI/USD market bears?
It would be difficult for bears to push further underneath the support level of $4 as the UNI/USD market fluctuates, bottoming on the support line.
Technically working out the possibility of the next moves, as indicated by the oscillator,the present level of market conditions may not get to seeing more reductions. Lesser risks will be incurred by launching long position orders at around $4 from now on.
In order to eliminate the likelihood of observing dependable lows around the trend line of the lower Bollinger Band, candlestick formation has been enfeebling for about three days in a row. On the premise that sellers should refrain from entering the market between the middle and lower Bollinger bands.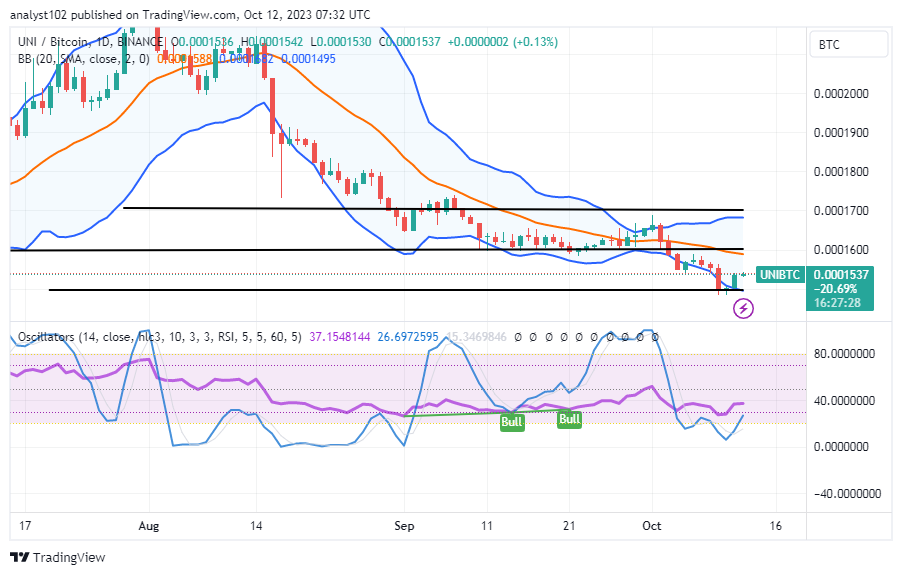
UNI/BTC Price Analysis
In contrast, the Uniswap market has bottomed on the buying threshold of the lower Bollinger Band trend line against the worth of Bitcoin.
The present arrangement pattern of the indicators showcases the Bollinger Band at the upper point, which is at the upper horizontal line, with the middle part going in the east direction, leaving the lower portion serving as the basis where the base crypto is surging against the counter crypto. It demonstrates that rising moments are just beginning the process of recovery.
Note: Cryptosignals.org is not a financial advisor. Do your research before investing your funds in any financial asset or presented product or event. We are not responsible for your investing results.
You can purchase Lucky Block here. Buy LBLOCK