Uniswap (UNI/USD) Price Pushes in Ranges, Featuring Lower Lows
Estimated Reading Time: 3 minutes
Don’t invest unless you’re prepared to lose all the money you invest. This is a high-risk investment and you are unlikely to be protected if something goes wrong. Take 2 minutes to learn more
Uniswap Price Prediction – September 21
An indication has been staging a depression signal from around the resistance line around $4.50 as the UNI/USD market pushes in ranges, featuring lower lows between the value line and the support of $4.
Since September 7 through September 18, long-position holders have been steadily losing momentum as they attempt to approach the $4.50 resistance line because the price has been moving slowly in negation between the high and low value points of $4.3938138 and $4.3177832 at a negative of 1.02%. It continues to confirm that buyers have not yet changed their attitudes toward a positive resumption trend.
UNI/USD Market
Key Levels:
Resistance levels:$4.50, $5, $5.50
Support levels: $4, $3.50, $3
UNI/USD – Daily Chart
The UNI/USD daily chart showcases the crypto-economic price pushes in ranges, featuring lower lows in the value lines of $4.50 and $4.
The 14-day SMA indicator is placed at $4.4951926, confirming the validity of a retarding force around the resistance line of $4.50 as the 50-day SMA indicator is at the topside, keeping a position value of $5.0408460. The stochastic oscillators have, for some time, conjoined in a consolidation-moving manner. But they have slightly crossed southbound from 92.90 to 88.90.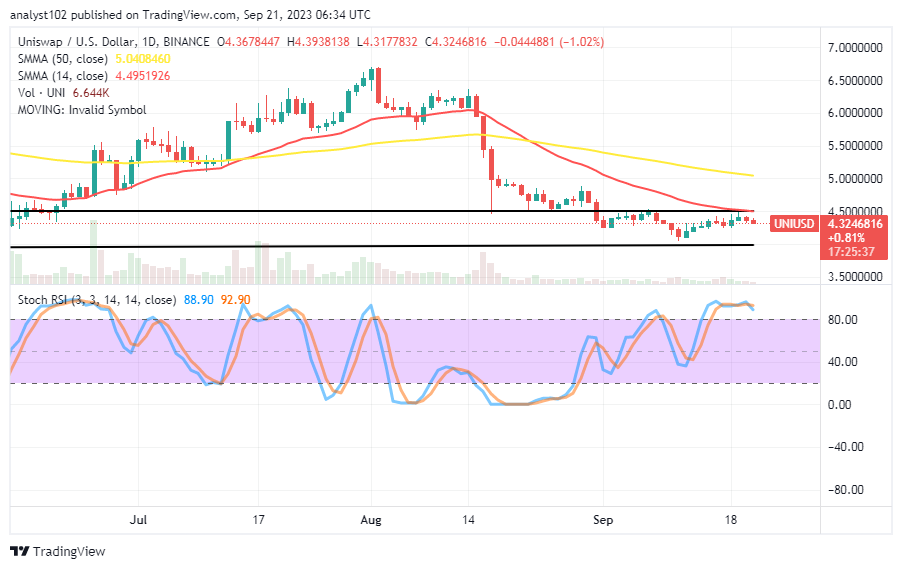
Should bears join forces against the $4 support line in the UNI/USD market if bulls eventually lose substantially in the range-bound areas?
As it has been technically observed, buying pressure has not been gaining the desired weight to drive out of a depression setting, given that the UNI/USD market pushes in ranges marked by $4.50 and $4, featuring lower lows.
It still seems likely that upward market movers would follow a procedure that highlights the need to employ a series of preventative measures in order to achieve excellent long-term returns. Investors should be cautious about exiting the market when the price is likely to fall back lower. Instead of making that choice, they could think of it as another opportunity to start a dip in the purchasing cycle before it recovers.
A rejection signal has been developing near the $4.50 market resistance line. Due to this view, positions should be shorted as soon as possible and just below that level, with a stop-loss execution order placed between the smaller and larger SMAs.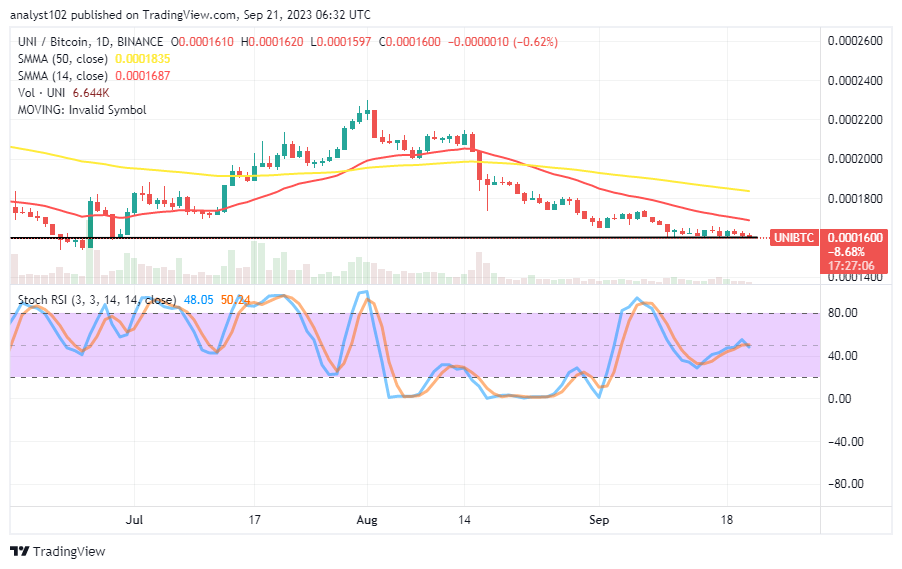
UNI/BTC Price Analysis
In contrast, the Uniswap market pushes into ranges beneath the moving average trend lines, featuring lower lows against the value of Bitcoin.
Compared to the 14-day SMA indicator, the 50-day SMA indication is higher. And over the course of a few sessions, they have continued to remain above market activity. The stochastic oscillators have been slanting slightly northward for a length of time, from a point just above 20 to a position between 50.24 and 48.05, indicating that a move to the downside is about to occur.
Note: Cryptosignals.org is not a financial advisor. Do your research before investing your funds in any financial asset or presented product or event. We are not responsible for your investing results.
You can purchase Lucky Block here. Buy LBLOCK