BNB Poises to Start a New Upswing as It Holds above the $242 Support
Estimated Reading Time: 2 minutes
Don’t invest unless you’re prepared to lose all the money you invest. This is a high-risk investment and you are unlikely to be protected if something goes wrong. Take 2 minutes to learn more

BNB (BNB) Long-Term Analysis: Bullish
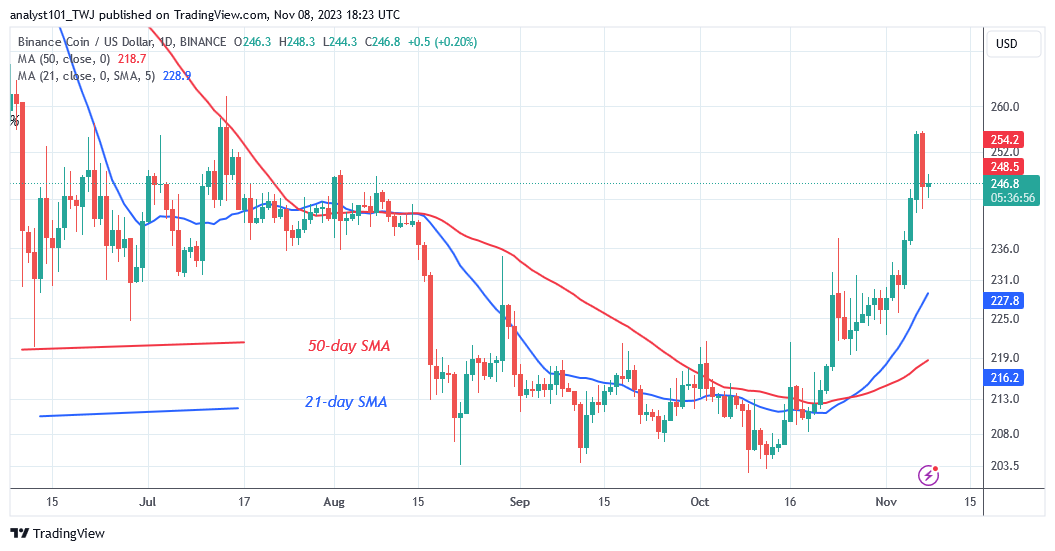
BNB (BNB) has risen to the historical price level of July 13 as it holds above the $242 support. The crypto asset surged to a high of $255.70, which corresponds to the July 13 price level. Further gains are unlikely because the market is deemed to be overbought. BNB is retracing today, reaching a low of $242.70.
The altcoin is still trading above the prior resistance level of $242 set on August 8. On the plus side, the altcoin will rise or break through the $255 resistance level. A break above the current high will send the coin to the $262 high. However, if the bullish scenario is invalidated due to the market’s overbought condition, BNB/USD will fall.
The altcoin will find support above $235 if it drops below the current level.
Technical indicators:
Major Resistance Levels – $440, $460, $480
Major Support Levels – $240, $220, $200
BNB (BNB) Indicator Analysis
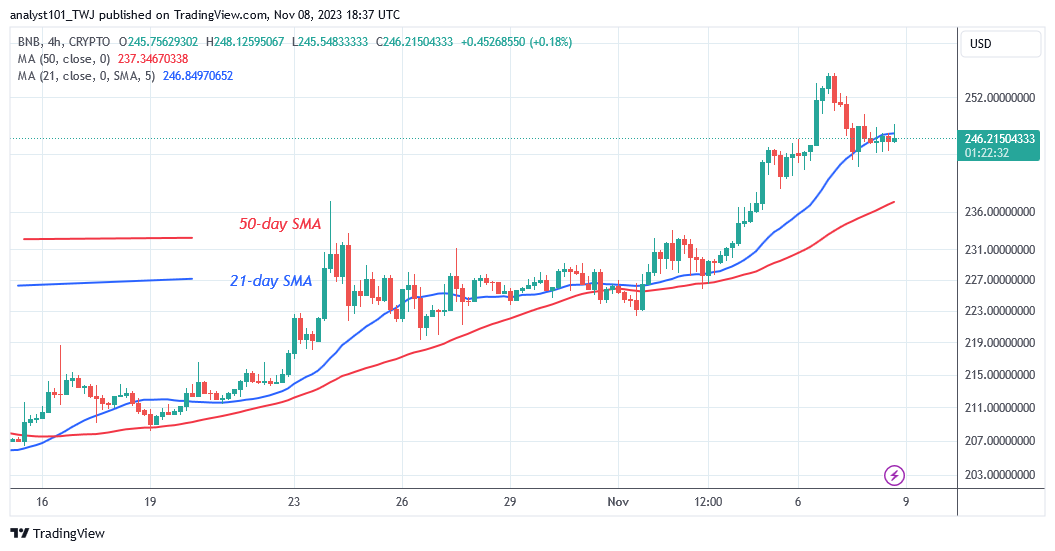
On the 4-hour chart, BNB retraces above the 21-day SMA after hitting the overbought level. The price bars moved above and below the 21-day SMA as the altcoin struggled to remain above it. Because the price bars are between the moving average lines, BNB is expected to trade sideways.
What Is the Next Direction for BNB (BNB)?
BNB/USD has resumed its upward trend as it holds above the $242 support level. The cryptocurrency is rising to retest the barrier level of $255. If the resistance is broken, the altcoin will surge even further. BNB, on the other hand, will develop a new price range between $242 and $255.
You can purchase crypto coins here. Buy LBLOCK
Note: Cryptosignals.org is not a financial advisor. Do your research before investing your funds in any financial asset or presented product or event. We are not responsible for your investing results