BNB Is in a Range as It Battles the $235 Overhead Resistance
Estimated Reading Time: 2 minutes
Don’t invest unless you’re prepared to lose all the money you invest. This is a high-risk investment and you are unlikely to be protected if something goes wrong. Take 2 minutes to learn more

BNB (BNB) Long-Term Analysis: Bullish
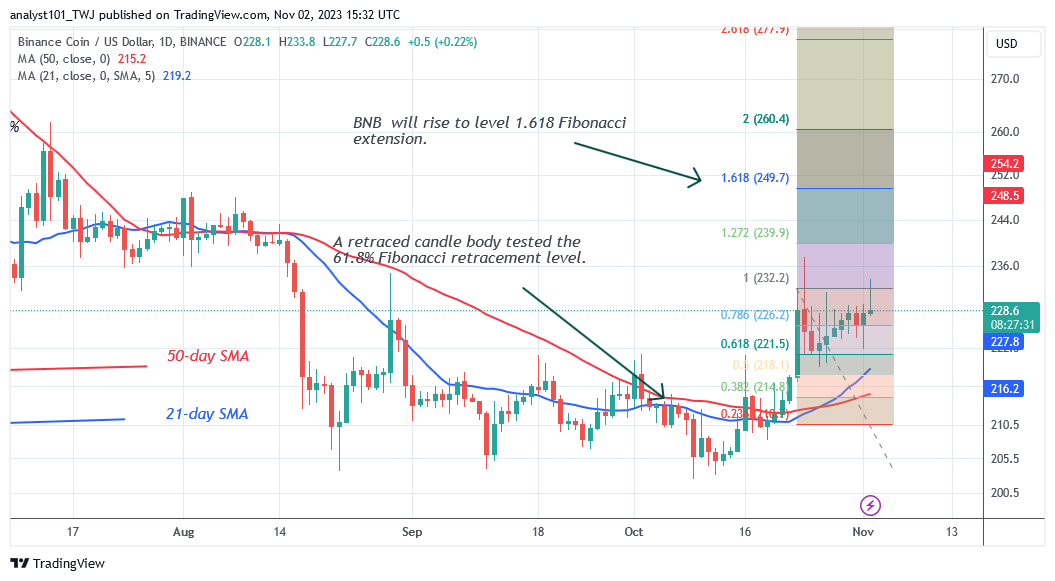
BNB (BNB) has maintained its upward trend as it battles the $235 overhead resistance. Buyers have persistently protected and maintained the price above the $220 breakthrough mark. They have, however, failed to sustain the price above the overhead barrier of $235. Since October 23, the cryptocurrency’s price has been between $220 and $235.
Buyers have made two failed attempts to break through the resistance level. Subsequent price drops were halted above the price breakthrough mark. On the plus side, if bulls retest resistance levels consistently, the altcoin will enter a bullish trend. The coin will reach a high of $250. Should the bullish scenario prove false, BNB/USD will decline and revisit its previous lows.
First, the altcoin will fall into a trading range between $203 and $220.
Technical indicators:
Major Resistance Levels – $440, $460, $480
Major Support Levels – $240, $220, $200
BNB (BNB) Indicator Analysis
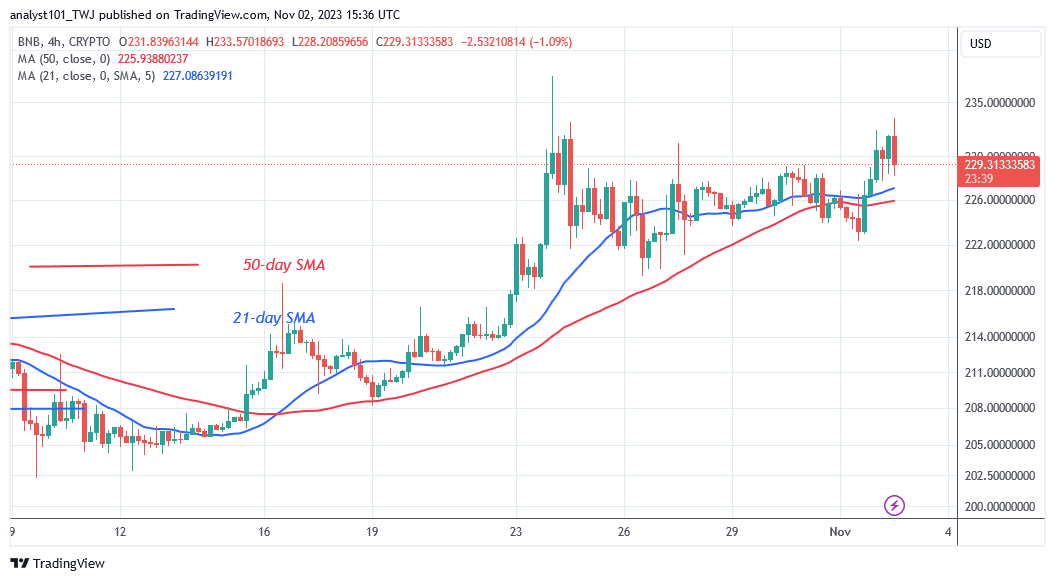
The price bars have retraced above the moving average lines after a strong rejection from the overhead barrier. The upward trend will continue as long as price bars stay above the moving average lines. The current upward trend will cease if the bears breach below the moving average line.
What Is the Next Direction for BNB (BNB)?
The cryptocurrency asset is caught above the moving average lines as it battles the $235 overhead resistance. The rising movement is contingent on breaking through the resistance level of $235. When the altcoin retests the moving average lines, it will rebound. This will push it back up against the overhead resistance. Since October 23, this has been the price action.
You can purchase crypto coins here. Buy LBLOCK
Note: Cryptosignals.org is not a financial advisor. Do your research before investing your funds in any financial asset or presented product or event. We are not responsible for your investing results