BNB May Retreat below $220 to Resume Its Range-Bound Pattern
Estimated Reading Time: 2 minutes
Don’t invest unless you’re prepared to lose all the money you invest. This is a high-risk investment and you are unlikely to be protected if something goes wrong. Take 2 minutes to learn more

BNB (BNB) Long-Term Analysis: Bullish
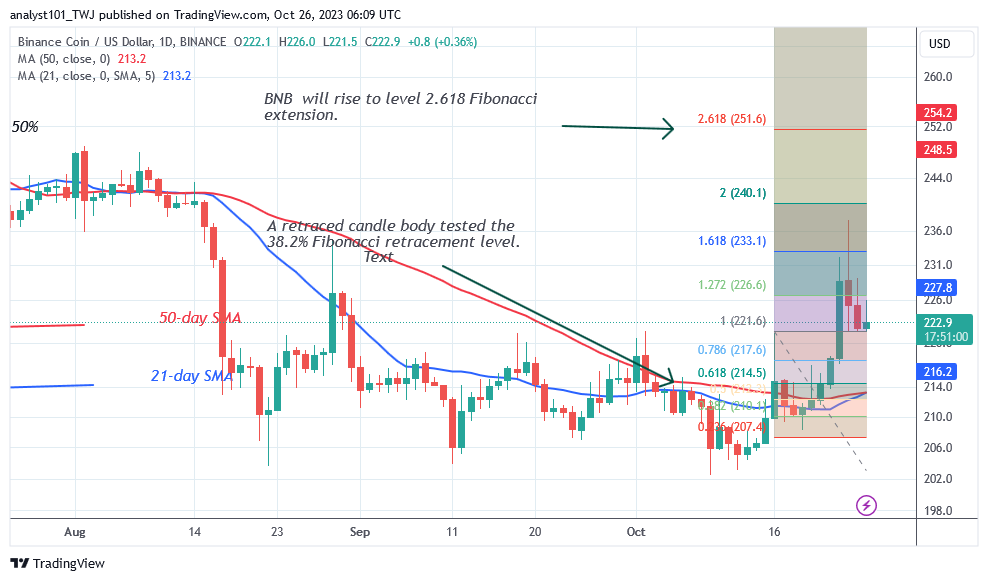
There has been a decline in BNB (BNB) prices as it attempts to resume its range-bound pattern. The crypto asset was trading in a bearish trend zone before the price increase. The altcoin surged to a high of $237.60 before plummeting. BNB was trading in a range of $200 to $220 before the breakout.
On the downside, if the altcoin retraces and goes below the $220 support, it will resume its range-bound behavior. The altcoin will drop and may return to its lower price range. The current upswing will continue if the currency retraces and stays above the $220 support level. The price indicator predicts that BNB/USD will soar to a high of $251.50.
Technical indicators:
Major Resistance Levels – $440, $460, $480
Major Support Levels – $240, $220, $200
BNB (BNB) Indicator Analysis
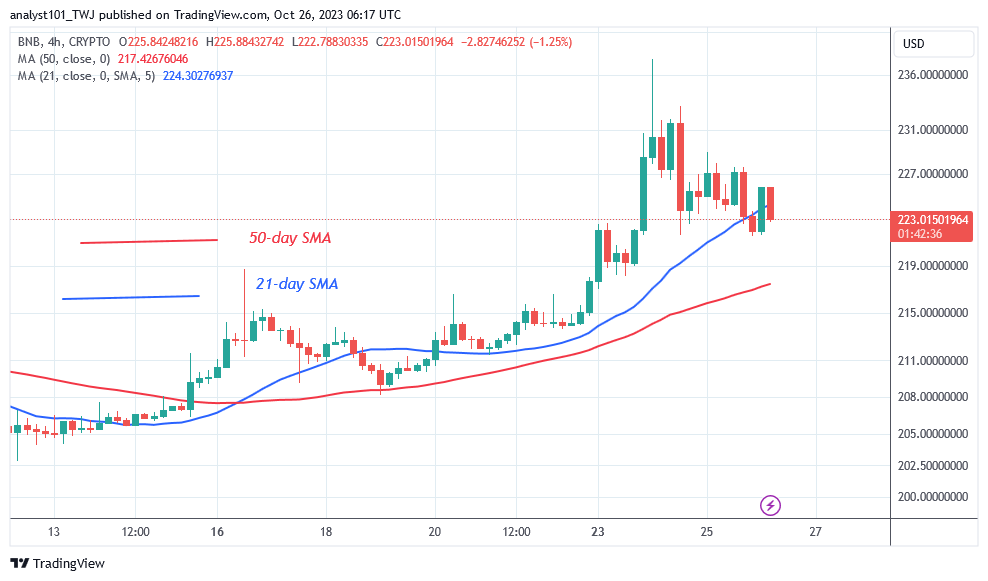
BNB is likely to rise if price bars retrace and find support above the lines of the moving average. The crypto price has plummeted between the moving average lines in the lower time frame. This will cause the coin to fluctuate even more.
What Is the Next Direction for BNB (BNB)?
The altcoin’s return to the range-bound pattern has resulted in a brief recovery in coin prices. The $220 support level is where the bears are trying to break below. BNB experienced severe resistance at $237 on October 24, prompting the candlestick’s wick to grow longer. The prolonged candlestick’s wick indicates strong selling pressure at higher price levels.
You can purchase crypto coins here. Buy LBLOCK
Note: Cryptosignals.org is not a financial advisor. Do your research before investing your funds in any financial asset or presented product or event. We are not responsible for your investing results