Tamadoge (TAMA/USD) Push for Higher Price Levels
Estimated Reading Time: 3 minutes
Don’t invest unless you’re prepared to lose all the money you invest. This is a high-risk investment and you are unlikely to be protected if something goes wrong. Take 2 minutes to learn more
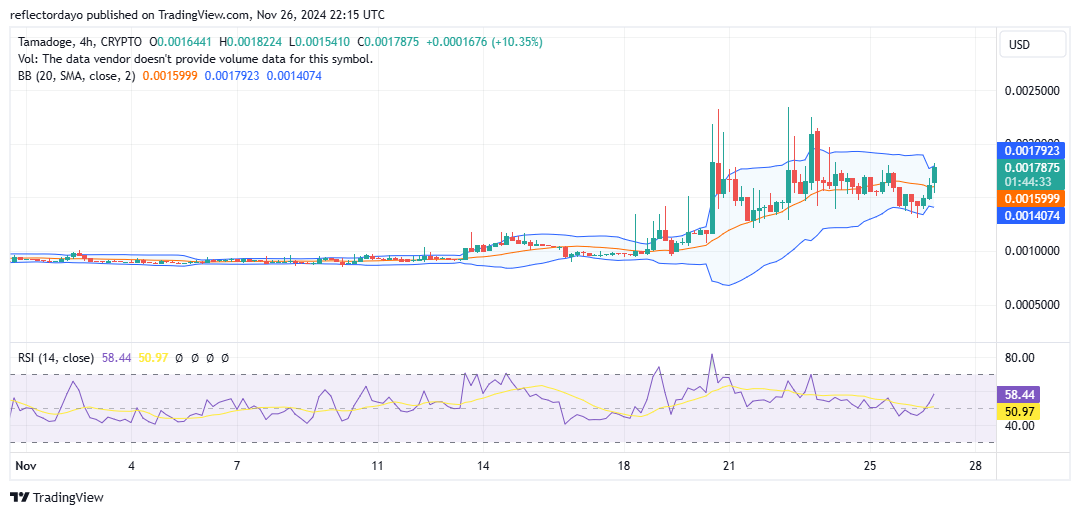
The Tamadoge (TAMA) market continues to hold firmly above the $0.0015 and $0.0016 levels, with signs of attempting higher price movements. Recent price action has displayed significant volatility, as bullish traders capitalized on opportunities to drive the price toward a peak near $0.0025 in prior sessions. Currently, the market appears to be consolidating within a defined range of $0.0015 to $0.0020. This consolidation suggests the potential for another bullish breakout in the crypto signal, with a possible target of surpassing the $0.0020 mark as upward momentum builds.
Key Levels
- Resistance: $0.0013, $0.0014, and $0.0015
- Support: $0.0008, $0.00078 and $0.00074
TAMA/USD Price Analysis: The Indicators’ Point of View
Recently, the market experienced a dip below the key support level of $0.00155, with expectations of a clear break below $0.0015 that could have triggered increased bearish sentiment among traders. However, the bulls quickly rallied around the $0.0014 level, initiating an upward recovery.
In the past few sessions, bearish resistance has been evident near the $0.0017 level, which is close to the critical $0.0015 support zone. This persistent bearish pressure briefly caused a breakdown below the $0.0015 support before the market rebounded above it.
Now a decisive break above the $0.0017 and $0.0018 resistance zones is crucial for sustaining the bullish momentum. This scenario appears attainable, given the strong rebound and the Tamadoge bulls’ ability to reclaim control at $0.0015.
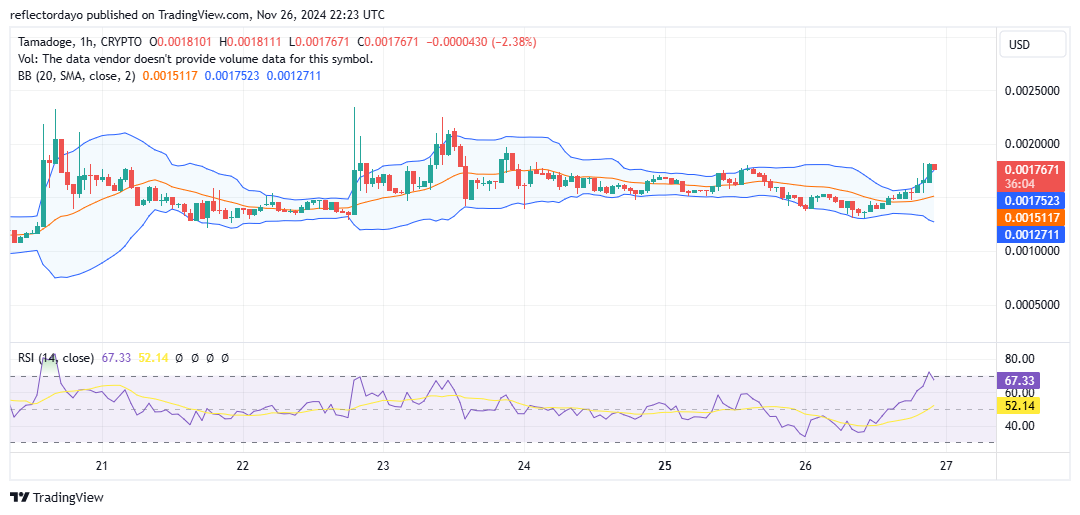
Tamadoge Short-Term Outlook: 1-Hour Chart
In the last two trading sessions, the bulls appear to have established a solid foothold at the $0.0016 level. In one of the recent sessions, trading activities were marked by a candlestick with small bodies and long upper and lower shadows, commonly referred to as long-legged dojis. This pattern indicates a strong tug-of-war between demand and supply at the $0.0016 price level.
However, in the subsequent session, the bulls gained full control, driving the market upward. The session was dominated by bullish sentiment but faced resistance at $0.00181. Moving forward, it is crucial for the market to maintain support at $0.0016 to sustain the momentum for continued upward movement.