Lucky Block Price Prediction: LBLOCK/USD Heads to the Upside
Estimated Reading Time: 3 minutes
Don’t invest unless you’re prepared to lose all the money you invest. This is a high-risk investment and you are unlikely to be protected if something goes wrong. Take 2 minutes to learn more

Free Crypto Signals Channel
The Lucky Block price prediction shows that LBLOCK is riding the bulls as traders are having a great moment ahead.
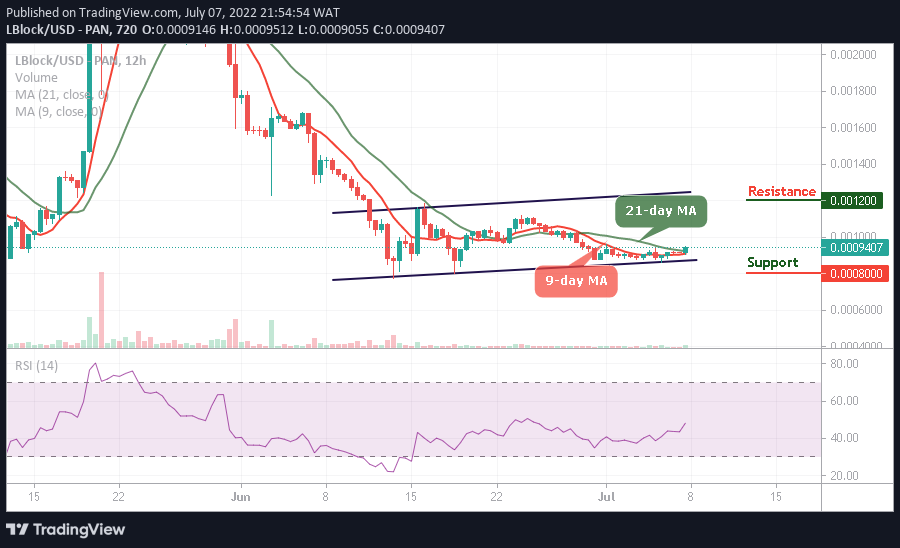
LBLOCK/USD Long-term Trend: Ranging (12H Chart)
Key Levels:
Resistance levels: $0.0012, $0.0014, $0.0016
Support levels: $0.0008, $0.0006, $0.0004
According to the chart, LBLOCK/USD may continue to follow the bullish movement as long as buyers increase their entries. Following the recent price, LBLOCK/USD is facing a potential resistance at the $0.0010 level above the 9-day and 21-day moving averages. However, a break above this barrier would produce a huge green candle towards the upper boundary of the channel, which could easily hit the resistance levels of $0.0012, $0.0014, and $0.0016.
Lucky Block Price Prediction: LBLOCK Price Will Gain More Upsides
The Lucky Block price is moving bullishly above the 9-day and 21-day moving averages. If the buyers increase their entries, the coin will touch the nearest resistance level of $0.0010. On the contrary, any slight retreat below the lower boundary of the channel could touch the supports at $0.0008, $0.0006, and $0.0004, giving room for the new buyers to surface. Positively, the technical indicator Relative Strength Index (14) is moving to cross above the 50-level to increase the bullish movement.
LBLOCK/USD Medium-term Trend: Ranging (4H Chart)
The Lucky Block price is attempting to cross above the upper boundary of the channel, but as it appeared, there’s a low amount of buying pressure in the market at the moment, which is why the price is finding it difficult to gain more upsides.
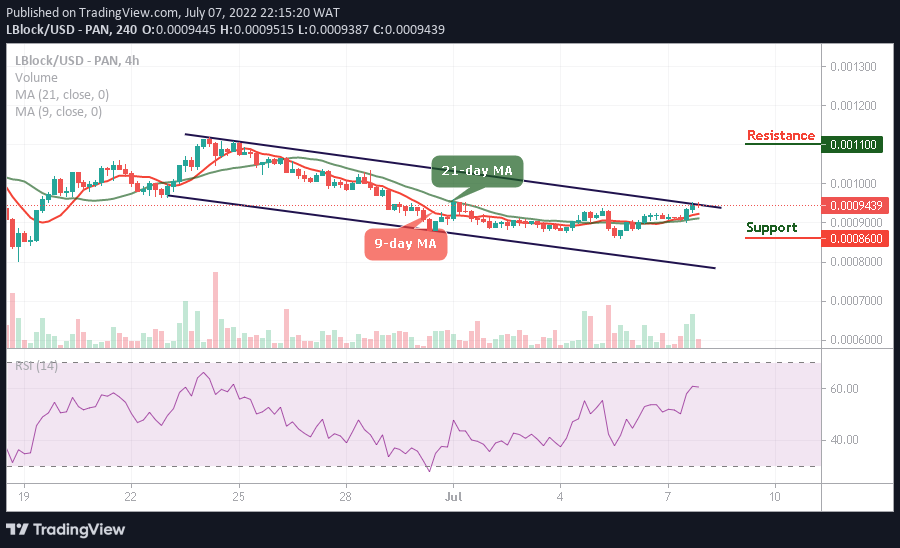
Therefore, if the bears try to break down the price, one would expect the market to touch the support level of $0.0086 and below. Meanwhile, a bullish continuation above the channel will push the market price to the resistance level of $0.0011 and above, while the technical indicator Relative Strength Index (14) moves above the 60-level.
You can purchase Lucky Block here. Buy LBlock