Lucky Block Price Prediction: LBLOCK/USD Moves Around $0.0008; Time to Buy the Dip
Estimated Reading Time: 3 minutes
Don’t invest unless you’re prepared to lose all the money you invest. This is a high-risk investment and you are unlikely to be protected if something goes wrong. Take 2 minutes to learn more

Free Crypto Signals Channel
The Lucky Block price prediction shows that LBLOCK keeps hovering around the moving averages; waiting for new buyers to come in.
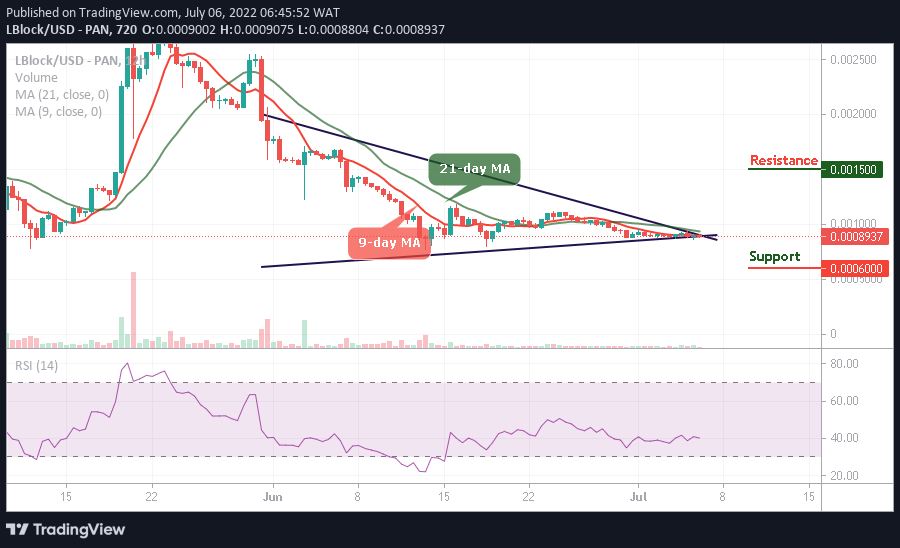
LBLOCK/USD Medium-term Trend: Ranging (12H Chart)
Key Levels:
Resistance levels: $0.0015, $0.0017, $0.0019
Support levels: $0.0006, $0.0004, $0.0002
LBLOCK/USD will in the next positive direction begin a bullish movement as the coin gets ready to create another higher level. The current movement is necessary for the coin to reach the resistance level of $0010 as the coin follows the bullish movement. Therefore, if the sellers push the market further lower, the support level of $0.0008 can be reached.
Lucky Block Price Prediction: LBLOCK/USD Will Consolidate to Shoot Higher
At the time of writing, the Lucky Block price is hovering around the 9-day and 21-day moving averages. If the coin retreats below $0.0008, it would be a good opportunity for investors to come into the market, and for the existing ones to buy the dip. Meanwhile, the technical indicator Relative Strength Index (14) is seen moving around the 40-level. Any bearish cross below this level may locate the supports at $0.0006, $0.0004, and $0.0002.
Moreover, if the buyers hold the current market value and push it to cross above the upper boundary of the channel, the bulls can break towards the upside, and any further bullish movement could hit the resistance levels at $0.0015, $0.0017, and $0.0019 respectively.
LBLOCK/USD Medium-term Trend: Bearish (4H Chart)
On the 4-hour chart, the Lucky Block (LBLOCK) is going to recover from the past losses as the coin is crossing above the 9-day and 21-day moving averages. Any further bullish movement to the upside could hit the resistance level of $0.0009.
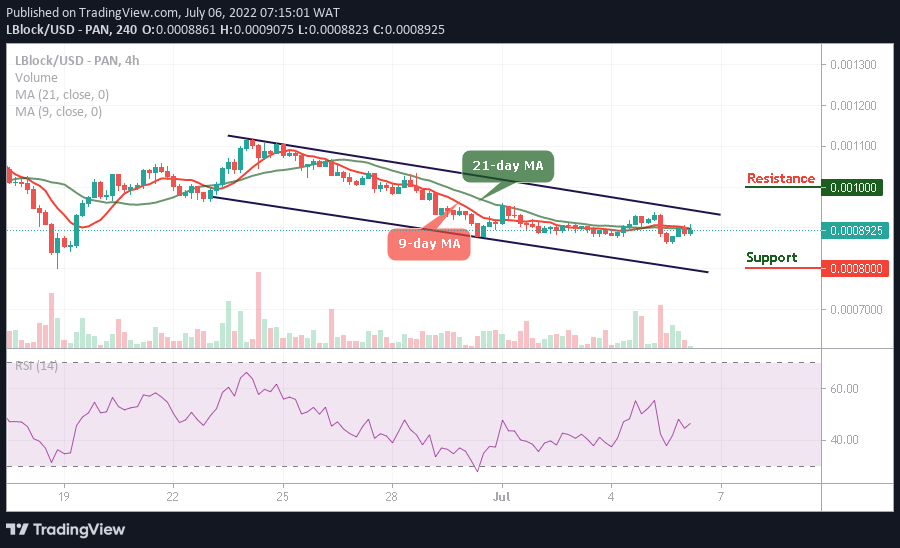
Nonetheless, the buyers are getting ready to spike above the moving averages, higher resistance could be located above the upper boundary of the channel at $0.0010 and above, but any bearish movement could hit the support at $0.0008 and below while the technical indicator Relative Strength Index (14) moves toward the 50-level, suggesting that the bullish signals are coming into focus.
You can purchase Lucky Block here. Buy LBlock