Lucky Block Price Prediction: LBLOCK/USD Will Surge Above $0.0009 Level
Estimated Reading Time: 2 minutes
Don’t invest unless you’re prepared to lose all the money you invest. This is a high-risk investment and you are unlikely to be protected if something goes wrong. Take 2 minutes to learn more

Free Crypto Signals Channel
The Lucky Block price prediction is moving to cross above the upper boundary of the channel for the confirmation of the bullish movement.
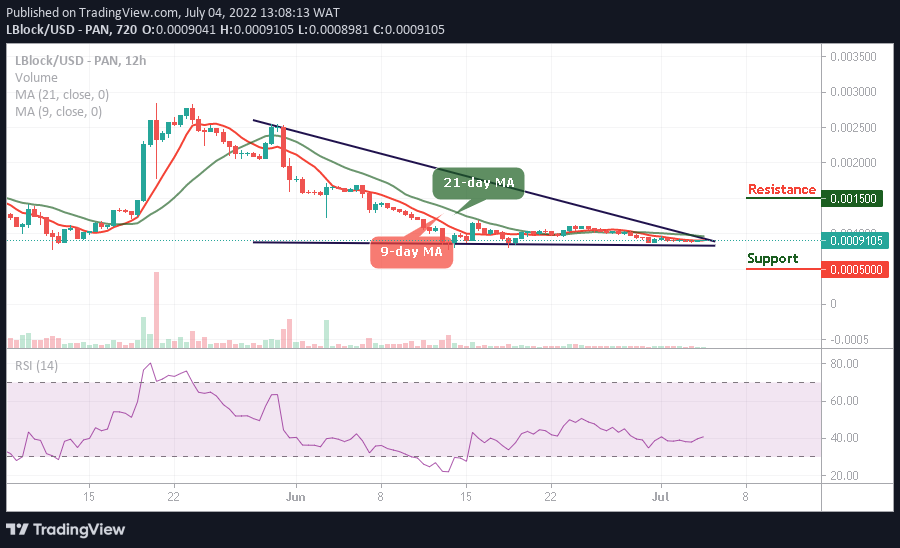
LBLOCK/USD Medium-term Trend: Ranging (12H Chart)
Key Levels:
Resistance levels: $0.0015, $0.0017, $0.0019
Support levels: $0.0005, $0.0003, $0.0001
After moving sideways for the past few weeks, LBLOCK/USD is ready to cross above the 9-day and 21-day moving averages for upward movement. The lucky Block price is therefore getting prepared to shoot above the moving averages as traders anticipate the current price movement indicating the upcoming price rally in the market.
Lucky Block Price Prediction: LBLOCK/USD Heads to the Positive Side
Looking at the 12-hour chart, the Lucky Block price will reclaim the resistance level of $0.0012 to face the possible resistance levels of $0.0015, $0.0017, and $0.0019. However, as the technical indicator Relative Strength Index (14) crosses above the 40-level if the bulls fail to push the coin to the north, the support levels of $0.0005, $0.0003, and $0.0001 may be found, which could be the best time for the new investors to come into focus.
LBLOCK/USD Medium-term Trend: Ranging (4H Chart)
On the 4-hour chart, the Lucky Block price is already hovering above the 9-day and 21-day moving averages, heading towards the channel’s upper boundary. However, the technical indicator Relative Strength Index (14) is moving towards the 55-level as the coin prepares for the north.
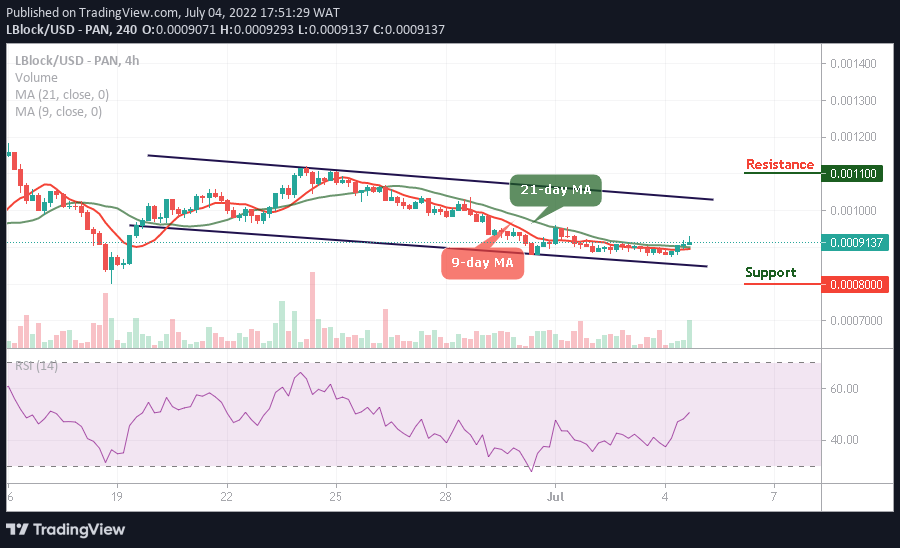
Moreover, if the bulls push the market price above the nearest resistance level of $0.0010, the Lucky Block would hit the potential resistance level of $0.0011 and above. On the contrary, any bearish movement below the lower boundary of the channel may reach the support level of $0.0008 and below as the new buyers are expected to come into the market once this comes to play.
You can purchase Lucky Block here. Buy LBlock