Polygon (POL) Price Prediction: POL/USDT Continues Trading Within a Narrow Range
Estimated Reading Time: 3 minutes
Don’t invest unless you’re prepared to lose all the money you invest. This is a high-risk investment and you are unlikely to be protected if something goes wrong. Take 2 minutes to learn more

Polygon (POL) Price Prediction: June 9
The Polygon market continues to lack the impetus that might deliver a significant push to price movement. Consequently, price action in the market continues to oscillate within a narrow range of 0.6425 to 0.7619. There was a significant price crash during the past two sessions, but market forces have managed to maintain the market within the above-stated price range.
POL/USDT Long-term Trend: Bullish (Daily Chart)
Key Price Levels:
Resistance Levels: $0.7500, $0.9000, and $1.500
Support Levels: $0.6000, $0.5000, and $0.4000
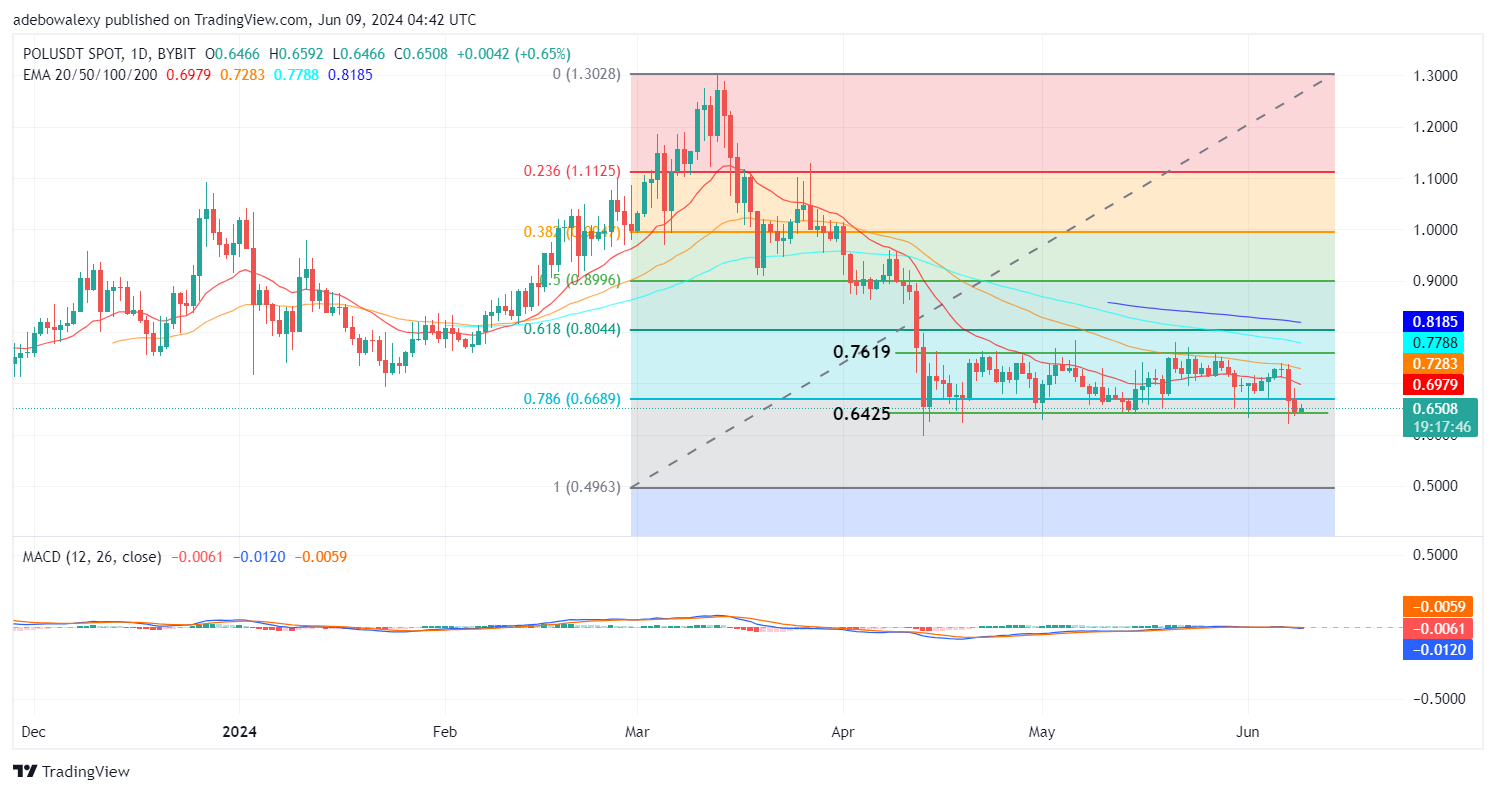
Over the past two sessions, price action fell below the 20-day Exponential Moving Average (EMA) line after a failed attempt to cross above the 50-day EMA line. However, buyers have managed to restrain price movement from breaking the support at the 0.6425 mark. The price of the Polygon token now lies below all the EMA curves. Meanwhile, the Moving Average Convergence Divergence (MACD) curve appears almost like a thin line. Nevertheless, looking at the indicator figure on the right shows that its lines are below the equilibrium level.
Polygon Price Prediction: POL/USDT Displays a Lackluster Performance
For a considerable length of time, the price of the Polygon token has been oscillating between a price range of 0.6425 and 0.7619. Through the daily price chart, it is revealed that the market crashed toward the support of a drawn sideways price channel at the 0.6425 price level.
This level lies below all the EMA lines, indicating that headwinds are still in charge. However, the appearance of a green price candle has kindled hope that the 0.6425 support won’t be broken. The market anticipates an upside rebound from here. Nevertheless, the thin appearance of the MACD lines suggests that the rebound may be weak initially.
POL/USDT Medium-term Trend: Polygon Continues to Post Minimal Profits (4H Chart)
Price action in the POL/USDT 4-hour market continues to record minimal profits for the second consecutive trading session. Be that as it may, the market still appears subdued below all the EMA lines. The last price candle on this chart is a bald one, indicating little downward pressure at the moment. Additionally, the MACD indicator lines are below the equilibrium level, but their bars are now pale red, showing that downward forces are losing momentum.
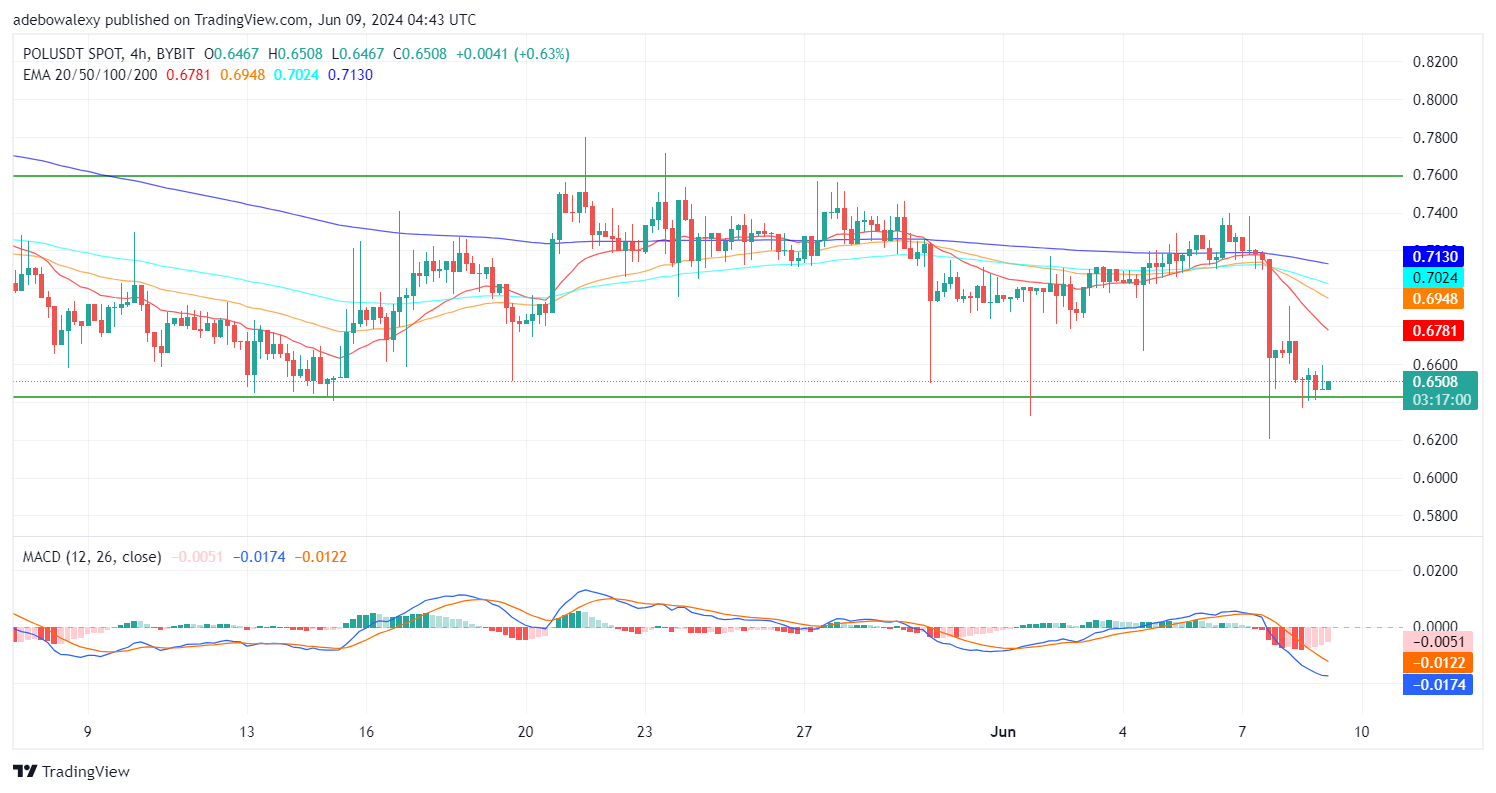
For the most part, the indications arising from trading indicators suggest that downward forces have had a significant effect on price movement. However, the daily and 4-hour price charts seem to be consistent with an upside rebound. Here, it can be seen that the upside rebound has stayed on for the second session, despite the fact that price action is below the EMA lines. The pale appearance of the MACD bars suggests that downward forces are now weak, leaving room for upside forces to push the market further up. Consequently, an upward correction toward the $0.7000 mark may be seen shortly.