Berachain (BERA/USDT) Faces Resistance Around $0.65 Amid Continued Downtrend
Estimated Reading Time: 3 minutes
Don’t invest unless you’re prepared to lose all the money you invest. This is a high-risk investment and you are unlikely to be protected if something goes wrong. Take 2 minutes to learn more

The market for Berachain against Tether over the last 24 hours rose by 1.63%, moving slightly to the north above the current day’s opening price. However, the pair appears to be underperforming the broader market gains, as activities within its ecosystem fail to propel the much-needed gains.
However, upon closer inspection, the longer-term bearish pressure still looms, and considering market dynamics like the drop in BTC dominance, the token may experience a short-term boost soon.
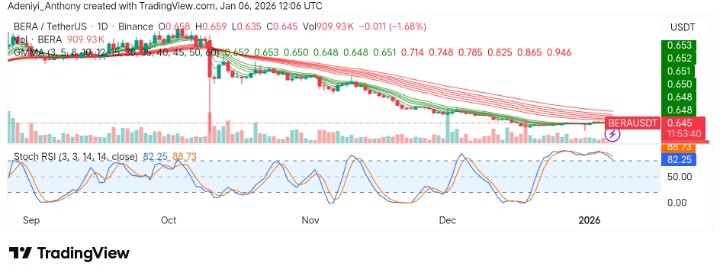
Currently, Berachain trades at $0.645, operating with more than 909,000 volumes for the day.
Technical Indicators
Major Resistance Levels: $0.640, $0.660, and $0.720
Major Support Levels: $0.630, $0.600, and $0.580
Technical Analysis
On the daily chart, Berachain against Tether appears to be consolidating after a failed attempt at breaking the $0.650 resistance level.
The Guppy Multiple Moving Averages (GMMA), on the one hand, is showing that the price was improving earlier but stalled as the sets of EMAs appear somewhat parallel to each other.
Additionally, the Stochastic RSI suggests that the pair is largely bearish, with evidence of an overbought condition, dropping lines, and fading volumes. To this end, Berachain may drop below $0.63 if the $0.640 is not maintained.
Technical Analysis: BERA/USDT
Executive Summary
Berachain (BERA) is exhibiting short-term strength with price trading above its key Exponential Moving Averages (EMAs) and a bullish crossover observed on the RSI indicator. While the immediate outlook appears positive, the broader… pic.twitter.com/YtxNPra07Y— cexscan (@cexscan) December 26, 2025
Meanwhile, according to a tweet from @Cexscan on December 26, 2025, Berachain (BERA) is showing short-term strength, with the price trading above its key Exponential Moving Averages (EMAs) and a bullish crossover observed on the Relative Strength Index (RSI) indicator. However, it has been observed that while the immediate outlook is positive, the broader market conditions and trends require caution.
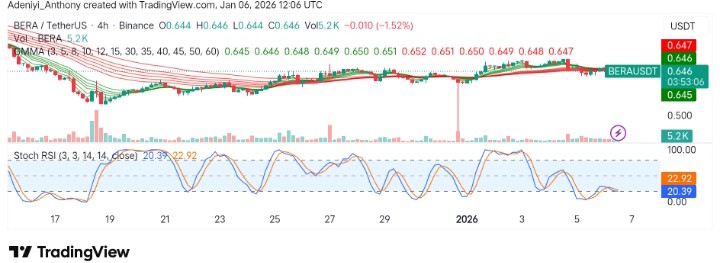
BERA/USDT Analysis: Testing Support Levels, What’s Next?
BERA/USDT appears to be exhibiting a significant downturn on the 4-hour timeframe. The pair seems to be testing the $0.640 support line, as the price stays below $1, a key indication of a bearish dominance.
However, the pair seems to be heading into the extreme oversold region, and a bounce at this point could warrant a move above $0.650, but volume remains relatively low.
You can purchase crypto coins here. Buy Crypto