Ethereum (ETH/USD) Shows Signs of Potential Downtrend
Estimated Reading Time: 3 minutes
Don’t invest unless you’re prepared to lose all the money you invest. This is a high-risk investment and you are unlikely to be protected if something goes wrong. Take 2 minutes to learn more
Ethereum Long-term Analysis: Bearish
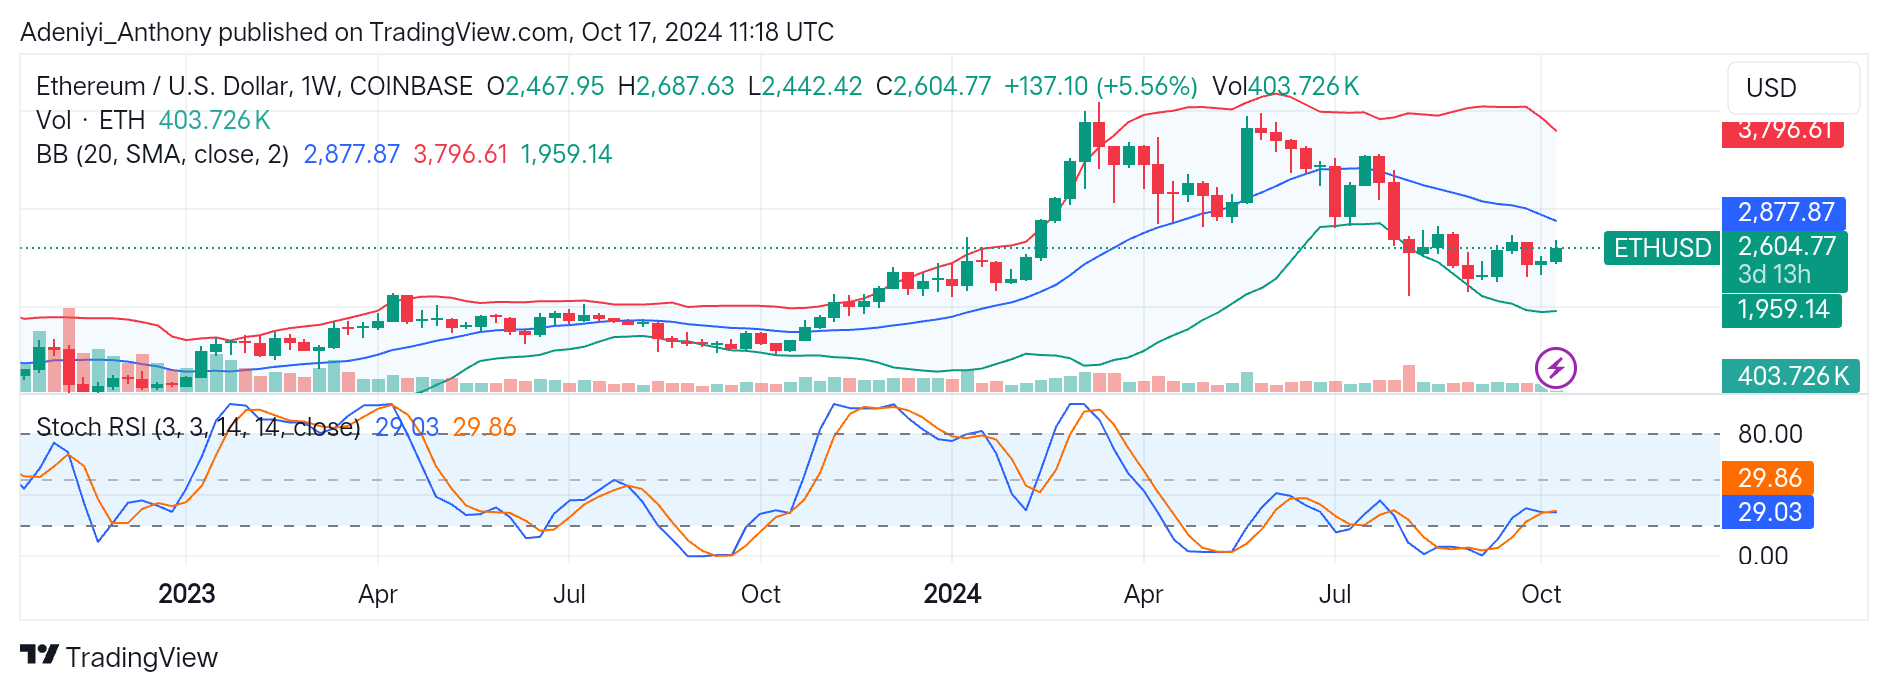
The Ethereum (ETH) against the United States Dollar (USD) again after a short pullback shows signs of further downtrend. ETH/USD has been on a prolonged downtrend for weeks characterized by low highs and lower lows. However, the current price actions of the pair under the middle Bollinger band suggest the pair’s oversold condition.
Recently, ETH/USD has been operating deep in the oversold region, as suggested by the Stochastic Relative Strength Index. However, the pair’s recovery to the upside seems to be a short one, as the line on the oscillator is already preparing for a crossover.
Therefore, with ETH/USD at a crucial point between $2,877.87 and $1,959, the condition for a continued uptrend remains that the pair trades above the mid-band; otherwise, a reversal is possible.
At present, the pair trades at $2,604.77, with a 5.56% positive from the previous trade.
Technical Indicators
Major Resistance Levels: $2,877.87, $3,000, and $3796.61
Major Support Levels: $2,442.42, $2,000, and $1,959.14
Ethereum Technical Analysis
Ethereum is operating closer to $2,877.87 than the lower band, around the $2,600 level. This means the short-term correction might be gaining strength. However, ETH/USD, as of the time of writing, operates very close to the middle band, but the current price between the lower and middle bands needs to improve. Also, the Stochastic RSI needs to extend upwardly before a bullish momentum can be confirmed.
On the other hand, with the current rising volume and the placement of the line on the Stochastic RSI, a reversal is possible if there is a further dip into the oversold region.
Traders are advised to watch out for key levels as the pair operates at a crucial level.
ETH/USD Analysis: a Potential Reversal or Continued Uptrend
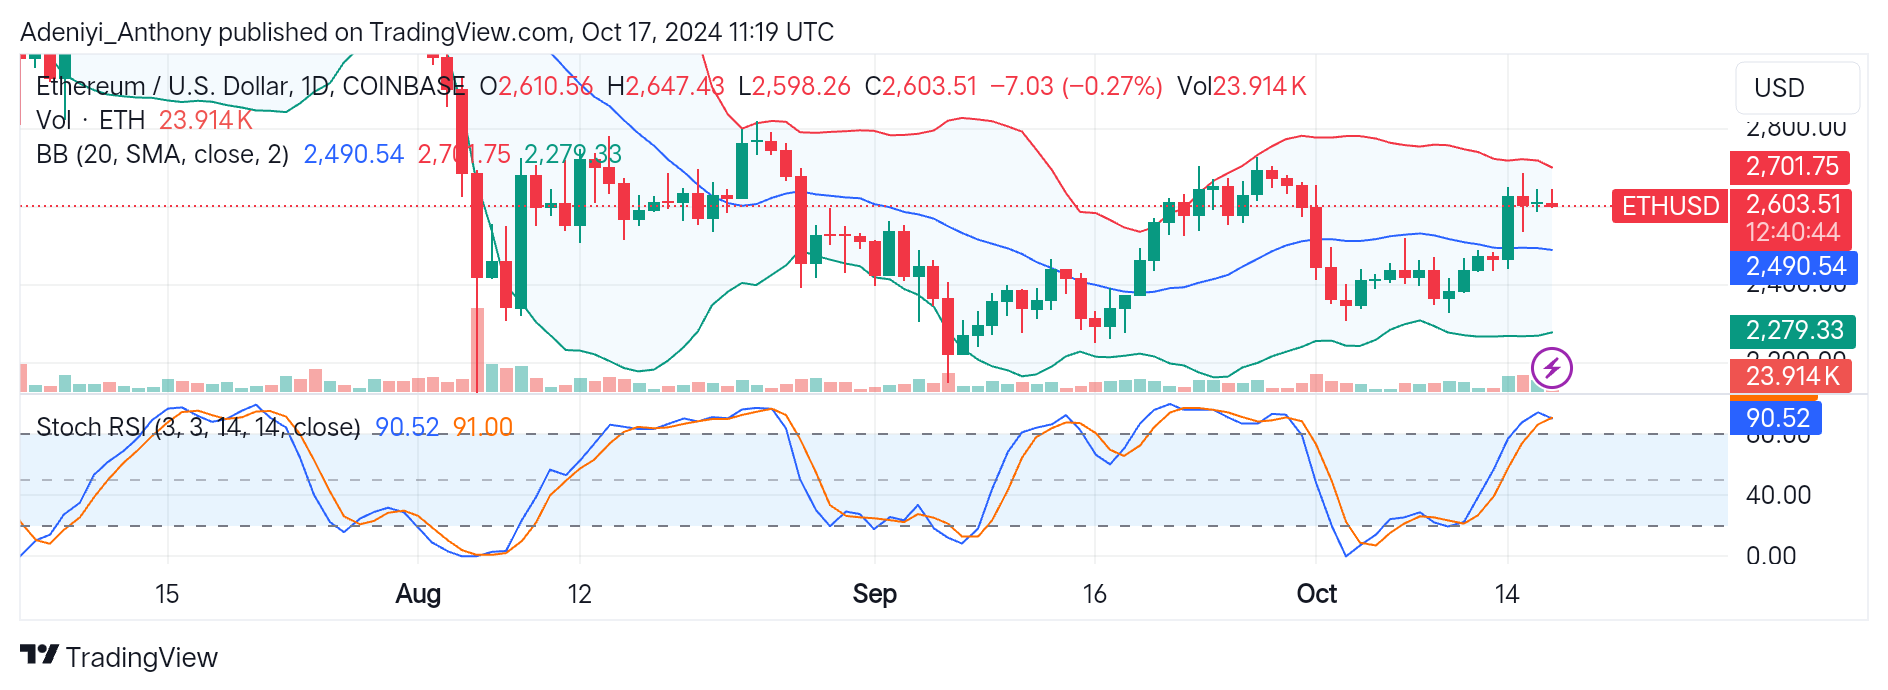
ETH/USD on the daily timeframe takes a different form, though valued at $2,603.51, the overbought condition displayed by both indicators suggests a potential reversal to the downside is on the horizon.
For a continued uptrend, the trading volume needs to increase with enough buying pressure on or above the upper Bollinger band. Therefore, price activities after the $2,701 level will confirm an uptrend.
However, with the current overbought condition and fall in volume, the pair might experience a pullback to the south, provided the pair trades under the mid-band at $2,490.54.
In conclusion, traders need to watch out for key levels in this timeframe, as the price may be suspended at the current location.
You can purchase crypto coins here. Buy LBlock