Ethereum (ETH/USD) Targets the $1,935.58 Level After Reversal
Estimated Reading Time: 3 minutes
Don’t invest unless you’re prepared to lose all the money you invest. This is a high-risk investment and you are unlikely to be protected if something goes wrong. Take 2 minutes to learn more
Ethereum Long-term Analysis: Bearish
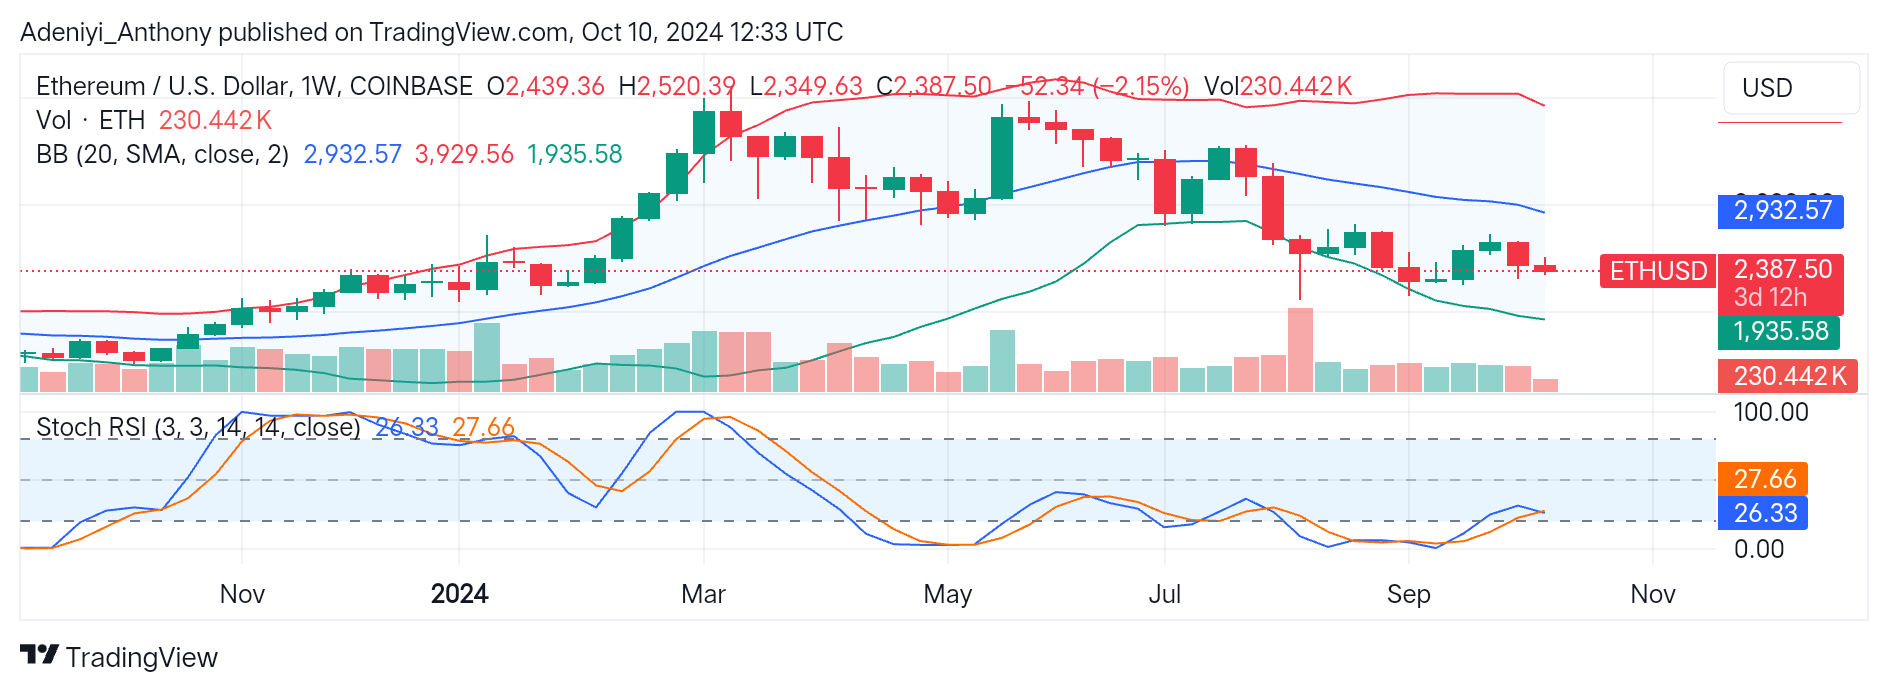
ETH/USD on a weekly and other timeframes has been on a prolonged downtrend, as depicted by the chart below. The recent price movement seems to be ranging after facing rejection before testing the middle Bollinger band. This is noticed in the recent candlestick formation and the pullback.
Recently, the pair has experienced strong volatility towards the south in the short term. The recent opening price at $2,349 and the recent low at $2,349.63 below the middle band indicate the price is close to breaking the immediate support.
With the current situation, a potential further downside movement is possible if the price breaks below $2,349, which is the recent low. On the other hand, the pair needs to break above $2,520.39 to confirm a bullish reversal.
At present, the price of Ethereum is $2,387.50, with a 2.15% decrease from the previous position.
Technical Analysis
Major Resistance Levels: $2,520, $2,932, and $3,929
Major Support Levels: $2,349, $1,935, and $1,500
Ethereum Technical Indicator Analysis
Ethereum against the U.S. Dollar is going through a short-term bearish reversal. However, the Bollinger bands and the Stochastic Relative Strength Index suggest the pair is currently operating in the oversold region. This means a recovery to the upside is possible if the pair finds strong support around the current level.
Ethereum Analysis: Continued Downtrend or a Potential Reversal to the Upside?
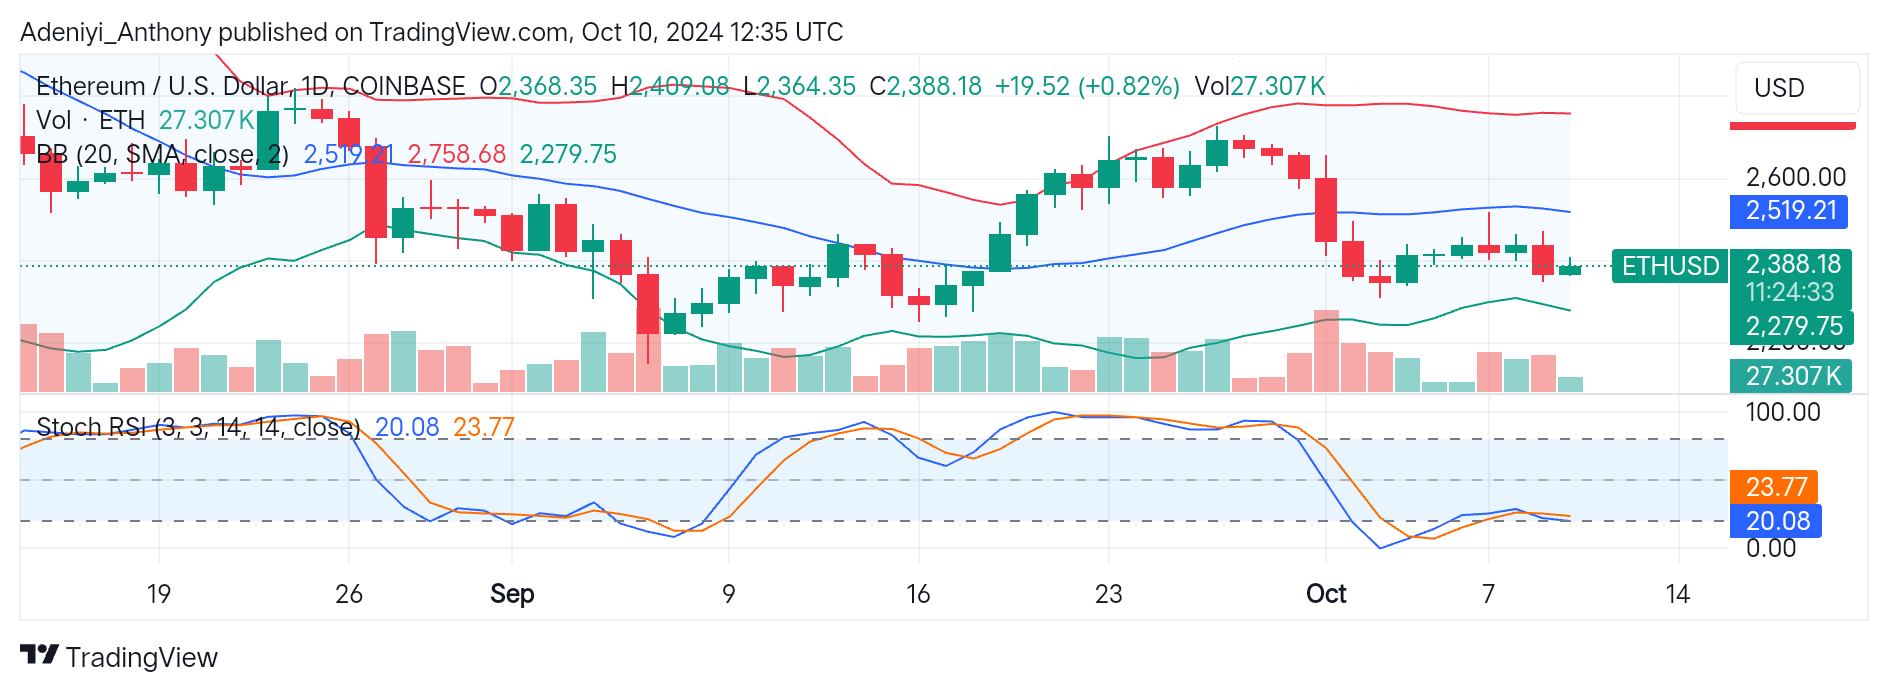
Ethereum against the U.S. dollar on the daily chart is slightly bullish. However, with the 0.82% change in price movement, it appears the bulls are not in full control of the market. Currently, the pair is trading within a tight space, which suggests low volatility but overall bearish momentum.
The Stochastic RSI below the chart presents the pair around an oversold region with extended lines, which produces the same signal as the nearness of the lower segment of the Bollinger bands. The market seems to be recovering from a downtrend, but a break above the $2,519.21 resistance level will confirm this upward trajectory. Otherwise, a break below the $2,279.75 level to the $2,260 level will lead to further downtrends.
You can purchase crypto coins here. Buy LBlock