Ethereum (ETH) Tests $2,335 as Selling Pressure Persists
Estimated Reading Time: 3 minutes
Don’t invest unless you’re prepared to lose all the money you invest. This is a high-risk investment and you are unlikely to be protected if something goes wrong. Take 2 minutes to learn more

Ethereum (ETH) Long-term Analysis: Bearish
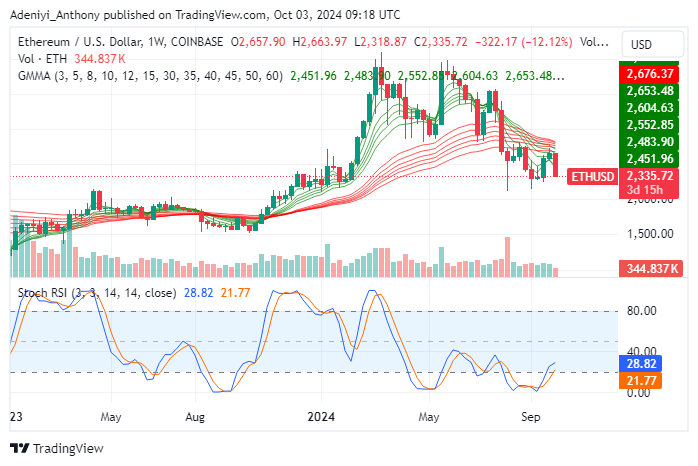
Ethereum against the United States Dollar has been oscillating between a recent high around $2,658.48 and the $2,335.72 support line. However, as selling pressure heightened, the pair’s price moved closer to the nearest support line. Whether the price will bounce back or pierce through hangs on the immediate buyers’ response.
The overall market condition of ETH/USD appears bearish, evidenced by the negative condition reflected by the Stochastic Relative Strength Index (RSI), which indicates the pair is in an oversold region. To this end, the fear of further downtrend is prevailing.
Recently, ETH traded near $2,600, the previous high. The coin has faced a sharp drop due to strong sell-offs in the market, as portrayed by the previous candlestick.
With the overall market condition, ETH/USD might test or break the support level around $2,355.72 if selling pressure persists. However, the oversold condition of Stochastic RSI suggests there might be a short-term bullish reversal. This offers the pair a chance to challenge the $2,658.48 again, provided there is enough momentum. Presently, the pair trades at $2,355.72.
Technical Indicators
Major Resistance Levels: $2,653.48, $2,663.97, and $2,676.37
Major Support Levels: $2,335.72, $2,318.37, and $2,251.96
Ethereum Technical Indicator Analysis
On the weekly chart, the Guppy Multiple Moving Averages (GMMA) capture the Ethereum short-term and long-term investors. The price in recent weeks has been trading under the short-period moving averages, which shows the pair is on a downtrend. The long-period averages display ETH/USD to be bullish in the longer term. However, the gap between the two groups of exponential moving averages is becoming smaller, signaling a crossover that could further cement the downtrend on the horizon.
ETH/USD Next Direction
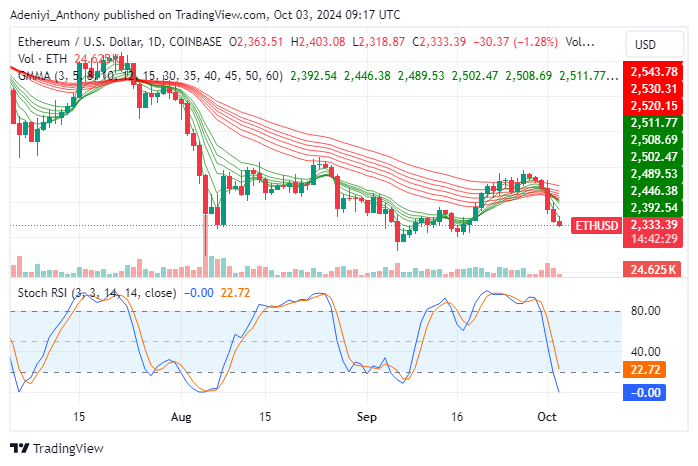
On the daily chart, ETH against USD is trading at $2,333.39 with the formation of bearish candlesticks. This shows the heavy presence of bearish traders in the market. The sell-offs are further confirmed by the crossover of the short-term and long-term exponential averages.
However, the Stochastic RSI is operating in the oversold region. This is an indication that a short-term retracement may occur if buyers step in on time.
You can purchase crypto coins here. Buy LBlock