Algorand (ALGO/USD) May Be Preparing for an Upward Break
Estimated Reading Time: 3 minutes
Don’t invest unless you’re prepared to lose all the money you invest. This is a high-risk investment and you are unlikely to be protected if something goes wrong. Take 2 minutes to learn more
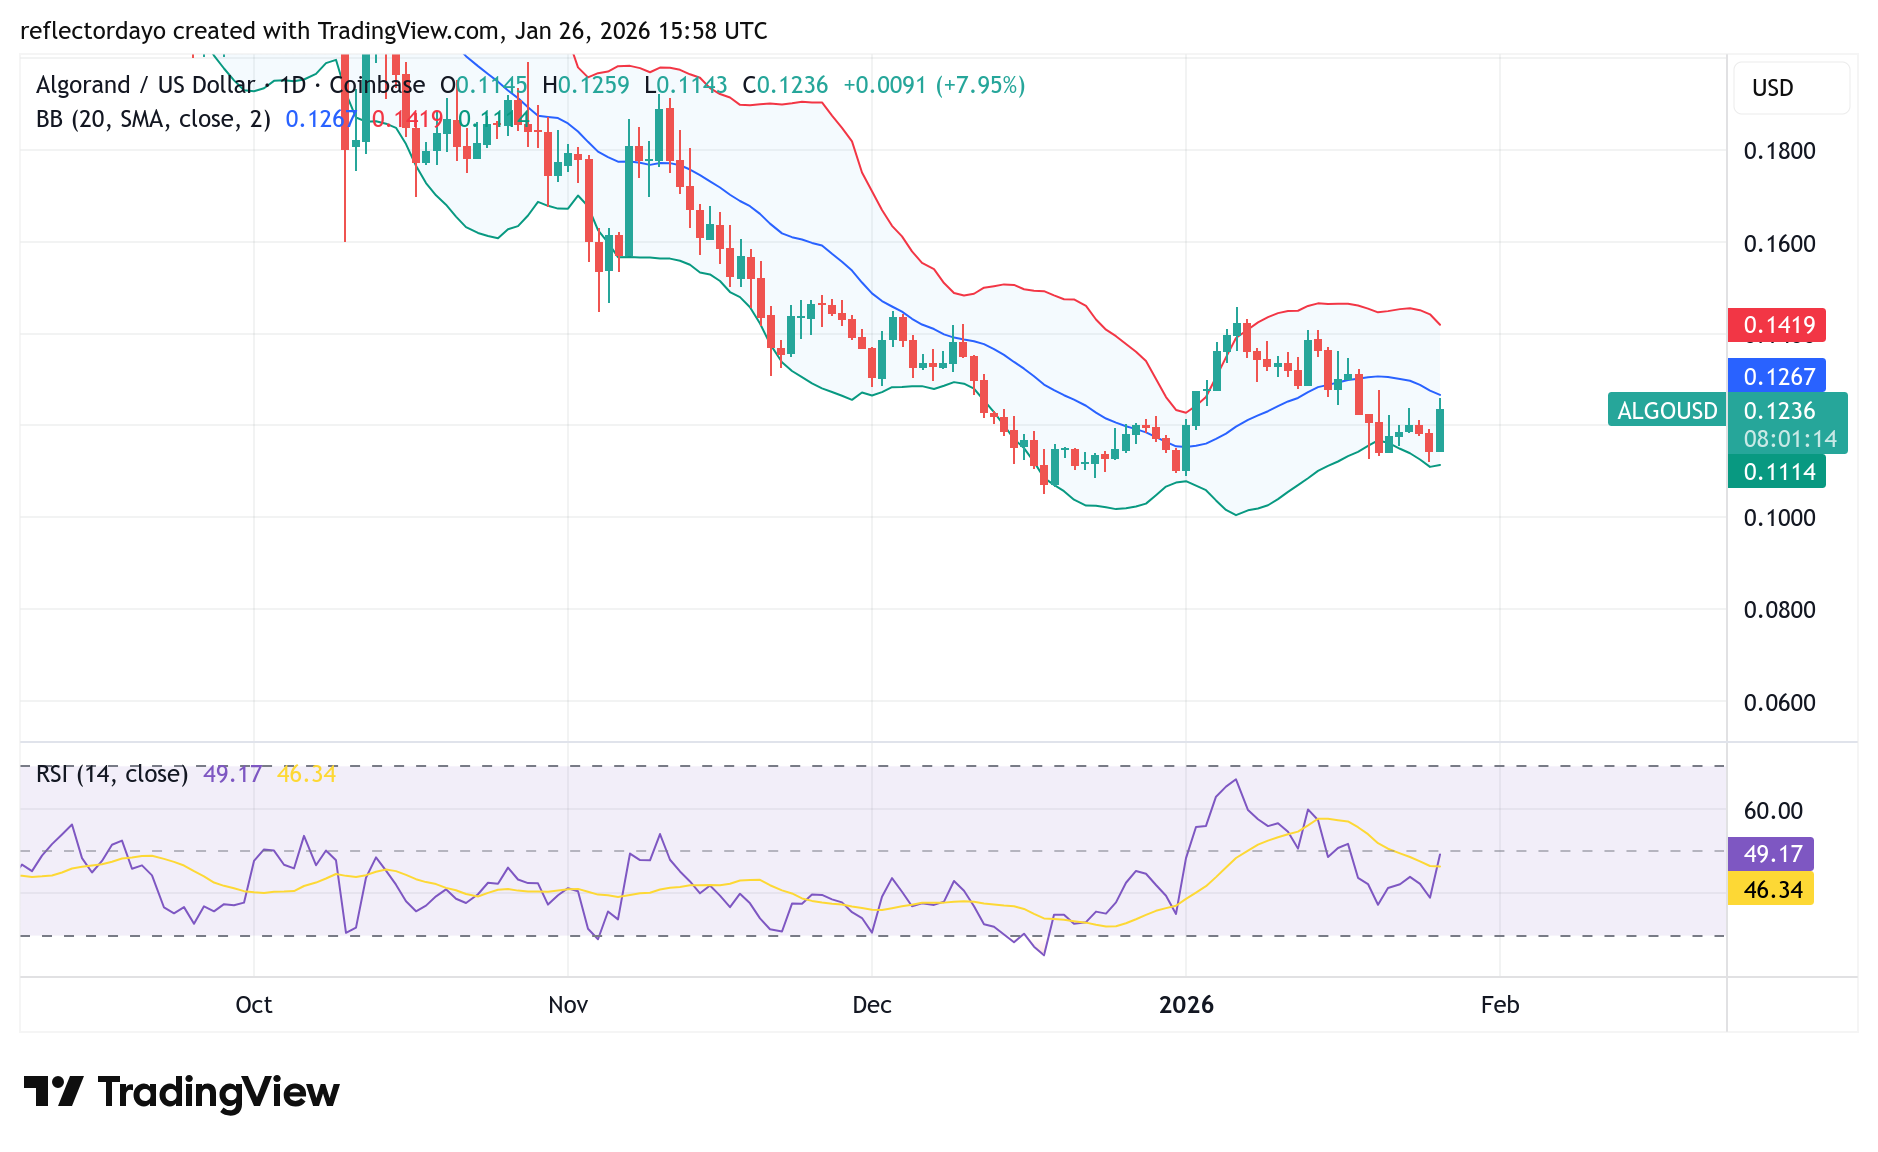
On December 18, Algorand broke out of its downward price movement around the $0.104 level. A strong support zone emerged in this area and has remained intact since then. However, a nearby resistance also formed around the $0.12 level, giving the impression that the market might consolidate at lower levels for some time.
As the new year began, market volatility picked up and bullish sentiment strengthened further. As a result, the resistance shifted higher to around the $0.14 price level, pointing to a growing upside bias.
Algorand (ALGO/USD) Market Data
- ALGO/USD Price Now: $0.1238
- ALGO/USD Market Capitalization: $67.8 million
- ALGO/USD Circulating Supply: 8.86 billion ALGO
- ALGO/USD Total Supply: 10 billion ALGO
- ALGO/USD CoinMarketCap Ranking: #61
Algorand Price Outlook: Accumulation Phase Signals Potential Major Upside
This video breaks down Algorand’s current market structure, emphasizing that while price action may appear slow, the ongoing consolidation could be a key accumulation phase. Using Elliott Wave analysis, it explains a prolonged Wave 2 range and outlines a potential Wave 3 move with significant upside, supported by bullish shifts in Market Cipher B money flow, VWAP flipping bullish, and emerging divergences across multiple timeframes. Although short-term risks such as RSI bearish divergence remain, stronger bullish signals are developing on higher timeframes, reinforcing long-term conviction. The analysis also highlights Fibonacci-based targets, broader macro accumulation conditions, and limited retail participation—factors that often precede explosive moves. Overall, the video presents a cautiously optimistic outlook for ALGO, positioning the current market phase as a strategic opportunity for long-term accumulation rather than short-term speculation.
Key Levels to Monitor
- Resistance: $0.14, $0.15, $0.16
- Support: $0.10, $0.09, $0.08
Algorand Market Analysis: Technical Viewpoint
Signs of a potential upward break become clearer when examining the chart through price action analysis. A closer look at the structure of recent price movements reveals subtle shifts in the lows, forming slightly ascending lows. Although modest, this pattern suggests a growing possibility of a breakout above the $0.14 price level.
The nearest resistance at $0.12 has been breached in today’s session, with price action attempting to sustain above this level. Despite some profit-taking pressure that pushed the price to a high of $0.1268, the Algorand market has since stabilized around $0.1238, indicating continued bullish interest.
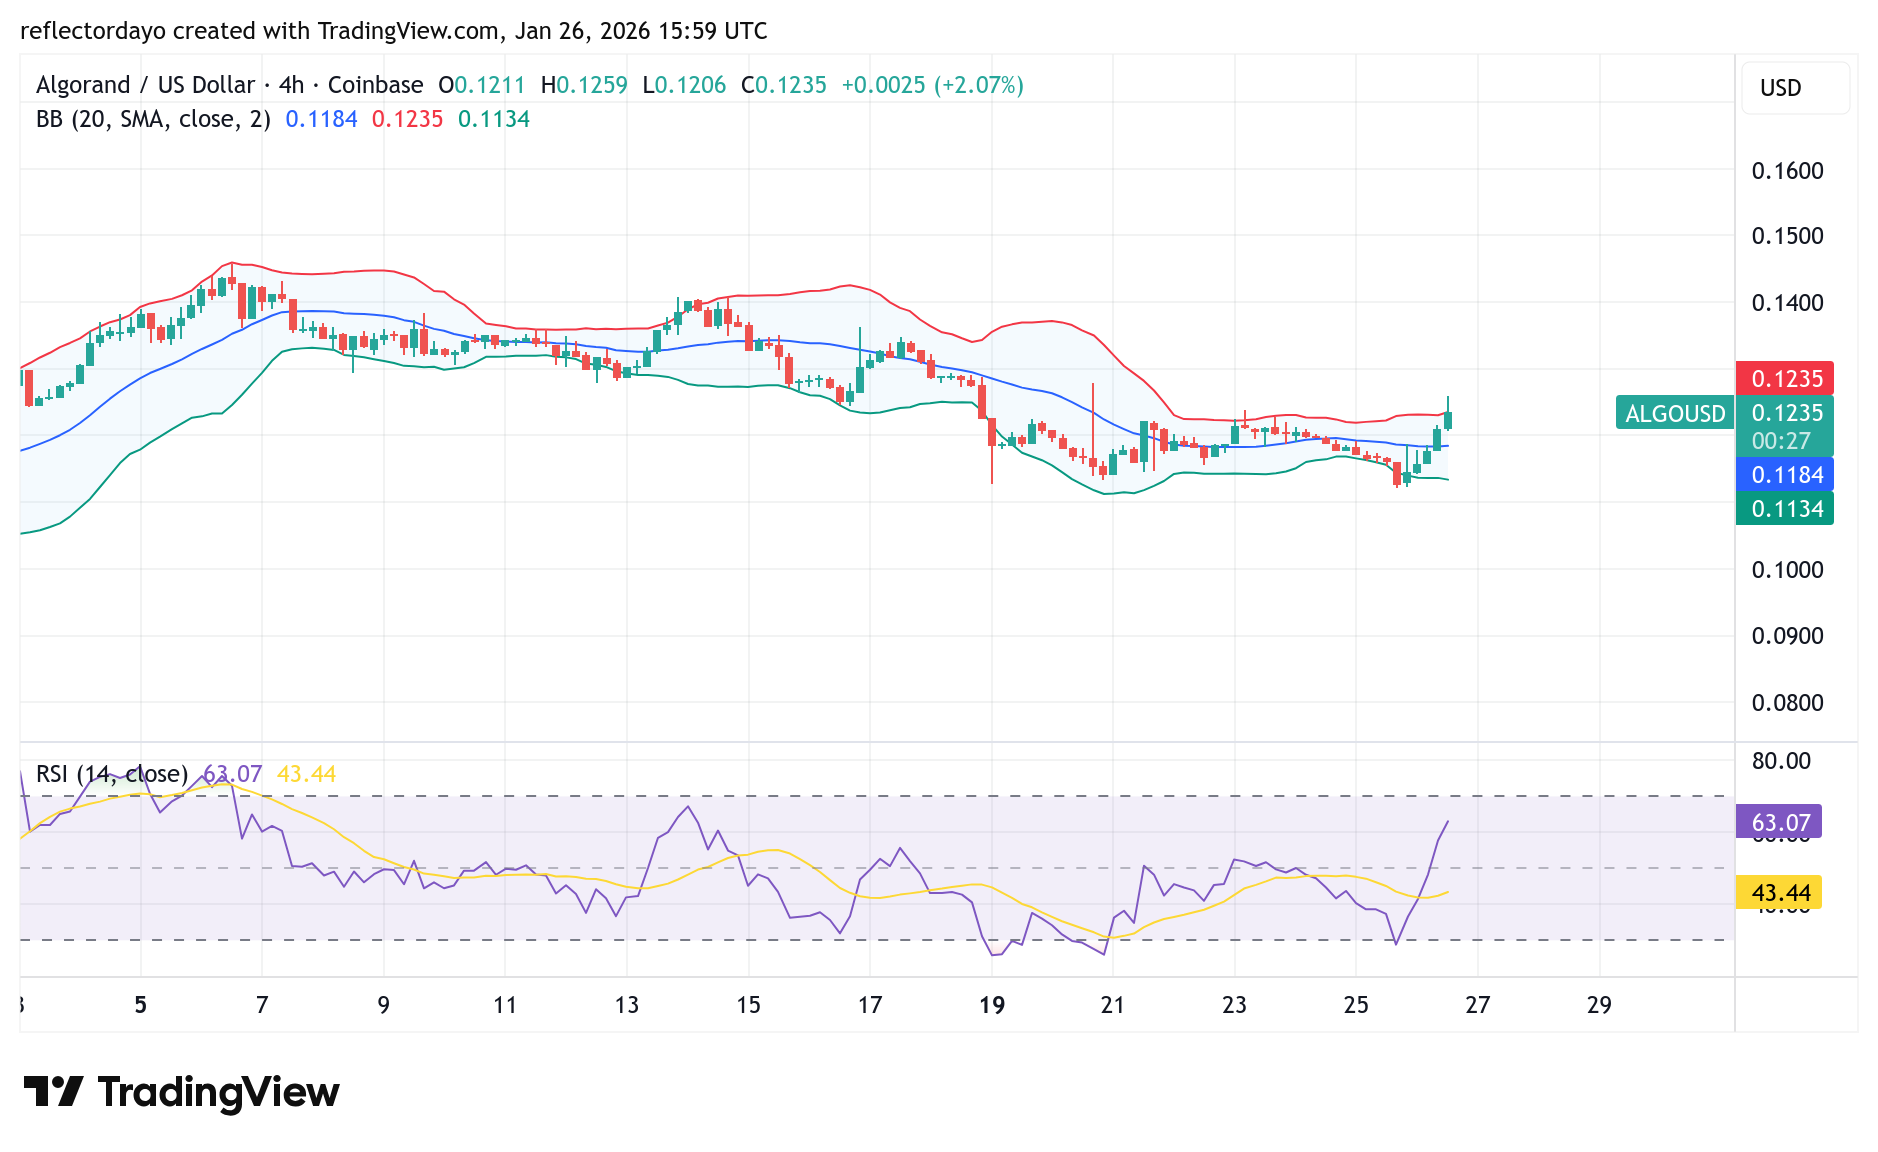
ALGOUSD 4-Hour Chart Outlook
As price action surges above the $0.12 level, it reflects an increase in market volatility. This heightened volatility may make it challenging for bulls to firmly maintain control around the $0.12 price area. However, for now, the market is sustaining above this critical level. If this holds, it could set the market on course for further upside price action, increasing the likelihood that a breakout toward the $0.14 price level may eventually materialize.