Ethereum Declines From $2,800 and Returns to Its Range
Estimated Reading Time: 2 minutes
Don’t invest unless you’re prepared to lose all the money you invest. This is a high-risk investment and you are unlikely to be protected if something goes wrong. Take 2 minutes to learn more
Ethereum Price Long-Term Analysis: Bullish
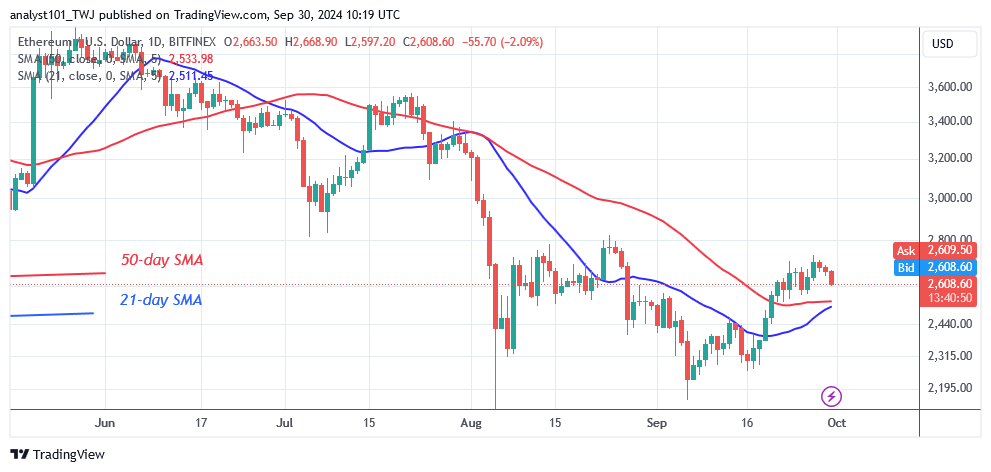
Ethereum’s (ETH) price has risen to a high of $2,732 but has returned to its range. Buyers could not maintain their bullish momentum above the $2,800 resistance, resulting in the fall. The largest altcoin is retreating to the moving average lines. Ether had previously traded in a range of $2,200 to $2,800. On the downside, Ether is expected to find support as it retraces above the moving average lines.
The current uptrend will resume if the altcoin retraces and remains above the moving average lines. The market will rise again to retest or break the $2,800 barrier level. However, if the bear breaches below the moving average lines, Ether will fall above the $2,300 support level. Meanwhile, the cryptocurrency is retracing above its moving average lines.
Technical indicators:
Major Resistance Levels – $3, 600, $3,800, $4,000
Major Support Levels – $2.600, $2, 400, $2,200
Ethereum Indicator Analysis
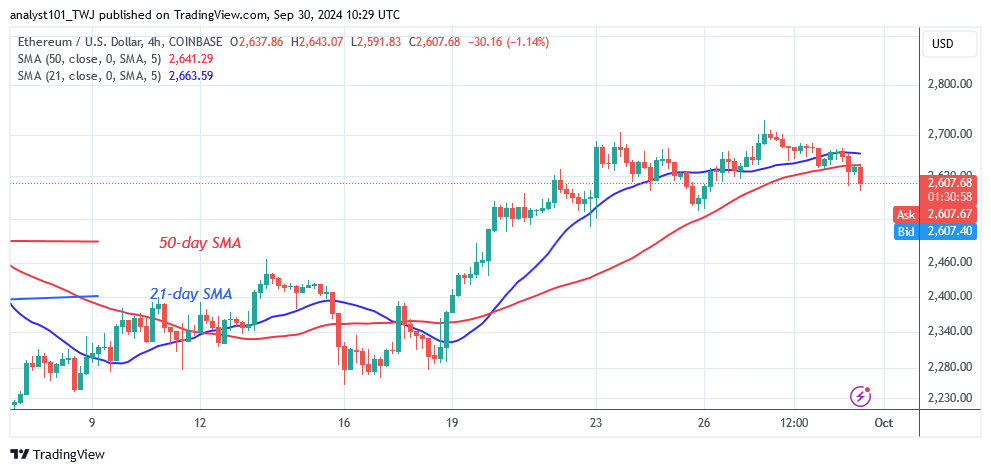
The daily chart shows Ether decreasing, although the price bars are above the moving average lines. The positive trend will end if the cryptocurrency price falls below the moving average lines. Nonetheless, the 4-hour chart shows bearish momentum breaking below the moving average lines. It predicts a further slide to the $2,500 support level.
Conclusion
Ethereum has fallen below the moving average lines as it returned to its range. The largest altcoin is retracing approaching its breakout mark of $2,500. The extended candlestick tails are pointing towards the $2,500 support. These candlesticks show heavy buying pressure above the $2,500 support. Meanwhile, the crypto signal is unfavorable, as the altcoin begins a downward trend.
You can purchase Lucky Block here. Buy LBLOCK
Note: Cryptosignals.org is not a financial advisor. Do your research before investing your funds in any financial asset or presented product or event. We are not responsible for your investing results.


