Polygon (ex-MATIC) Price Prediction: POL/USDT Gains Traction Above the $0.2000 Price Level
Estimated Reading Time: 3 minutes
Don’t invest unless you’re prepared to lose all the money you invest. This is a high-risk investment and you are unlikely to be protected if something goes wrong. Take 2 minutes to learn more

Polygon (ex-MATIC) Price Prediction: April 26, 2025
The ex-MATIC token recently resurfaced above the $0.2000 price mark, causing the market to rise above important technical levels. Furthermore, indications are suggesting that additional price increases may occur, despite the current market consolidation.
POL/USDT Long-Term Trend: Bullish (Daily Chart)
Key Price Levels:
Resistance: $0.2500, $0.3000, $0.3500
Support: $0.2000, $0.1500, $0.1000
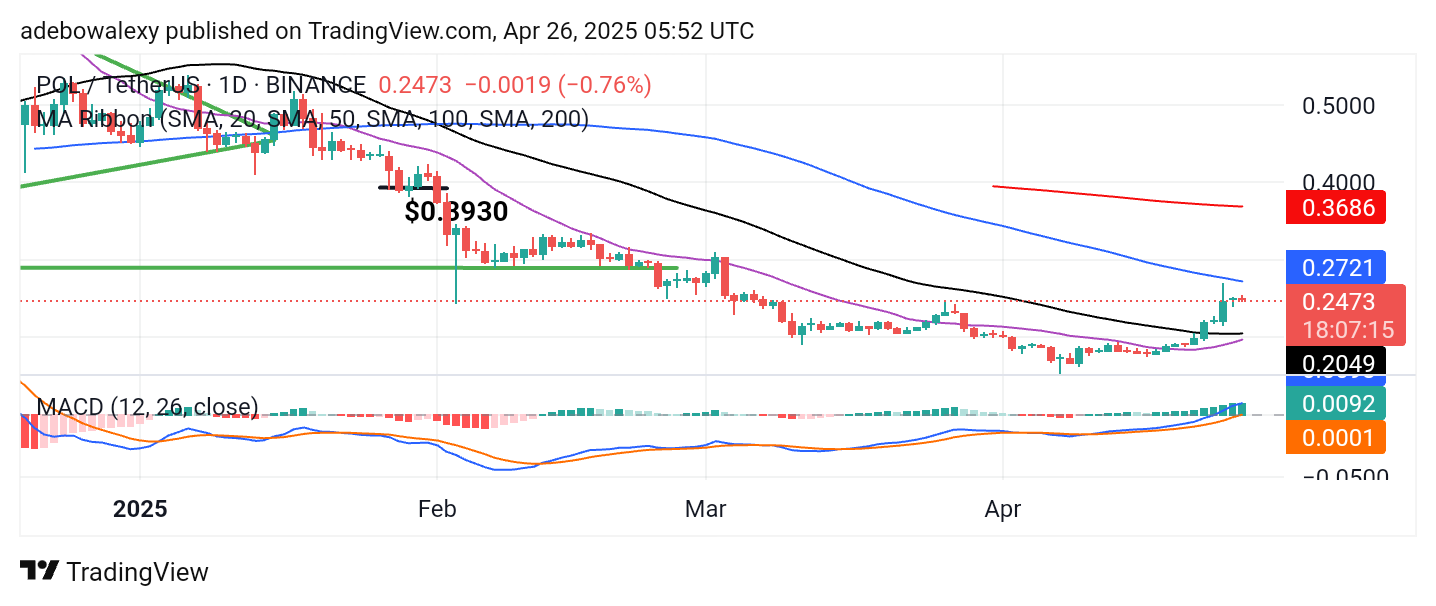
Price activity in the Polygon (ex-MATIC) daily market has risen above the 20- and 50-day Moving Average (MA) lines. However, since the previous session, the market has struggled to proceed higher. The latest price candle on the chart has appeared red, albeit small in size. Meanwhile, the Moving Average Convergence Divergence (MACD) indicator lines are pushing through the equilibrium level. Similarly, the bars of the MACD remain green and above the equilibrium level.
Polygon (ex-MATIC) Price Prediction: POL/USDT Shows Bullish Potential
The fact that price activity in the Polygon (ex-MATIC) daily market has risen past two of the four MA lines suggests that this market has the potential to continue moving upward. However, it appears that after price action tested the 100-day MA line, it retreated into consolidation just below that technical landmark.
Nevertheless, the MACD indicator lines continue on an upward trajectory above the equilibrium level. Similarly, the bars of this indicator continue to appear green above the equilibrium line, indicating that bullish momentum is still present. Technically, this suggests that upside forces may still be active.
Polygon (ex-MATIC) Price Prediction: POL/USDT May Break Out of Consolidation
On the Polygon (ex-MATIC) 4-hour chart, price action has surpassed all the MA lines. However, the last two price candles have appeared red, showing only minimal price changes, thereby maintaining the ongoing consolidation movement.
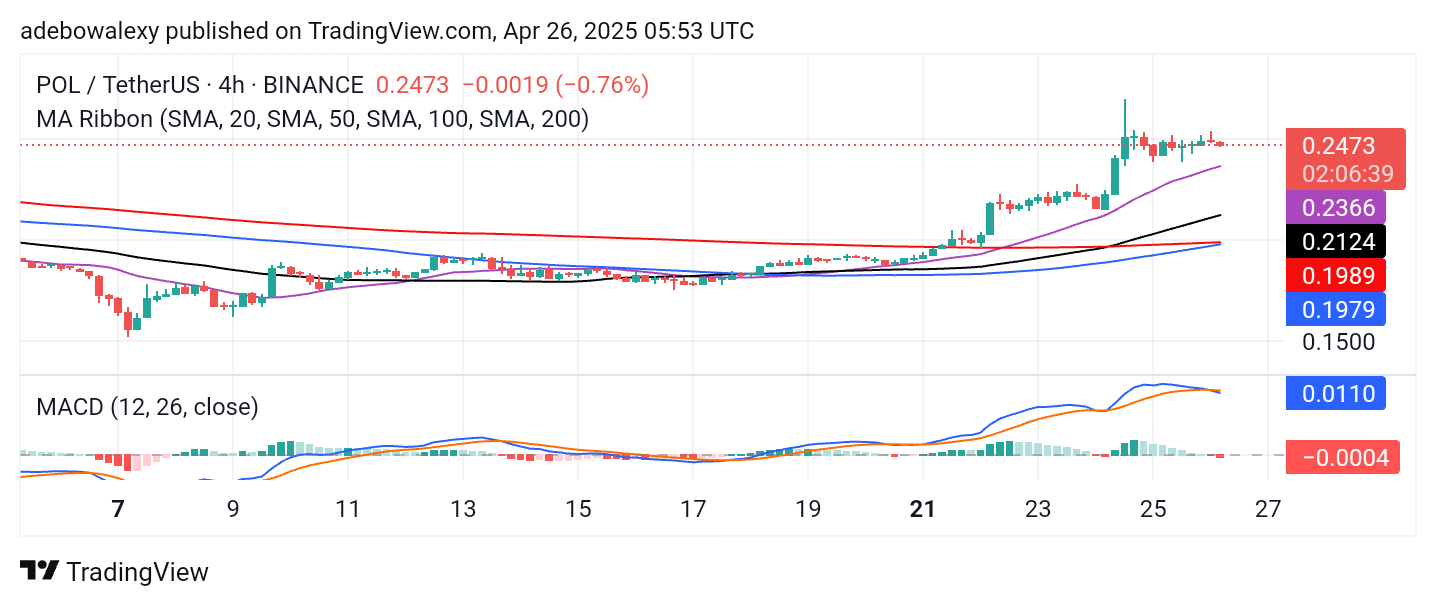
Meanwhile, the 100- and 200-day MA curves are converging below the price action. The MACD lines on this chart are positioned significantly above the equilibrium level. Although the MACD lines have crossed above the equilibrium level, they currently appear to be moving sideways. Therefore, traders can anticipate that the market may soon breach the $0.3000 price level.