ChainLink (LINK/USDT) Testing Support and Resistance Levels Amid a Market Correction
Estimated Reading Time: 3 minutes
Don’t invest unless you’re prepared to lose all the money you invest. This is a high-risk investment and you are unlikely to be protected if something goes wrong. Take 2 minutes to learn more

The market for ChainLink against Tether appears to have fallen marginally and is now operating slightly close to $18.00. However, the overall trend, however, remains bullish with significant price movement between support and resistance levels.
As it stands, fear sentiment coupled with Bitcoin dominance, failure to hold the pivot point, and regulatory overhang happen to be creating uncertainty issues for the network.
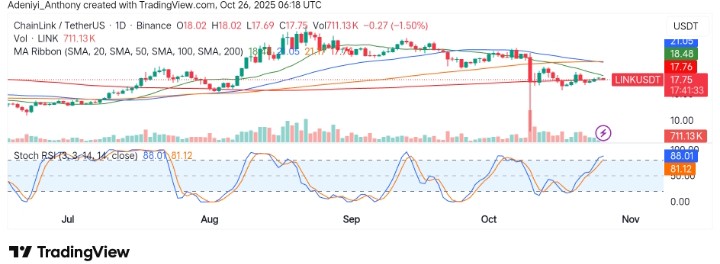
Currently, ChainLink trades at $17.75 with more than 711 thousand circulating supply for the day.
Technical Indicators
Major Resistance Levels: $18.48, $19.96, and $22.00
Major Support Levels: $17.16, $16.00, and $15.00
Technical Analysis
Technically, ChainLink against Tether was previously showing a strong uptrend. Now, it appears that the price is consolidating above a critical moving average (SMA).
However, the price is facing resistance near $18.48, and the Stochastic RSI is in overbought territory, suggesting that a retracement may be close. As it stands, the support level at $17.75 has been tested repeatedly, and if it holds, there could be further upward momentum.
To this end, a break below this support level would suggest a potential retracement towards $17.16.
$LINK: Since the Monday high, price has formed a three-wave pullback, with the current micro support zone between $16.40 and $17.36. So far, there has been no clear bullish reaction from this area. Immediate micro resistance is found between $19.18 and $19.68. pic.twitter.com/KrcXlYCz5u
— More Crypto Online (@Morecryptoonl) October 22, 2025
Meanwhile, @Morecryptoonline has suggested that ChainLink’s price has pulled back in three waves since the Monday high, with the current micro support zone being between $16.40 and $17.36. There hasn’t been any obvious bullish response from this region thus far. The range of immediate micro resistance is $19.18 to $19.68.
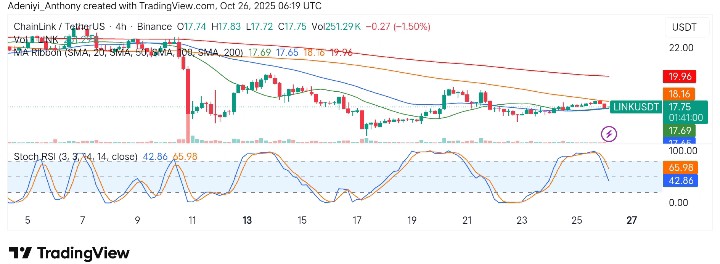
LINK/USDT Analysis: Holding Between Key Levels
On the 4-hour chart, LINK/USDT has been trading between $17.75 and $17.69, with a downward bias indicated by the recent move below the SMA ribbon.
Meanwhile, it appears that the Stochastic RSI shows that the coin is nearing oversold conditions (below 50), which could signal a reversal.
To this end, a break above the $17.75 level could trigger further upside towards $18.16. Conversely, if the price fails to hold above $17.69, it could drop further, testing the next support levels around $17.45 and $17.16.
You can purchase crypto coins here. Buy Crypto