Bitcoin (BTC/USD) Price Is Hovering at $21,500
Estimated Reading Time: 3 minutes
Don’t invest unless you’re prepared to lose all the money you invest. This is a high-risk investment and you are unlikely to be protected if something goes wrong. Take 2 minutes to learn more

Free Crypto Signals Channel
Bitcoin Price Prediction – July 17
The BTC/USD market price is hovering at $21,500 as it puts more slight force to the upside above the $20,000 psychological trading spot. Over a couple of hours has led to a high and a low of $21,660 and $21,068 at a 1.69% positive.
BTC/USD Market
Key Levels
Resistance levels: $22,500, $25,000, $27,500
Support levels: $20,000, $17,500, $15,500
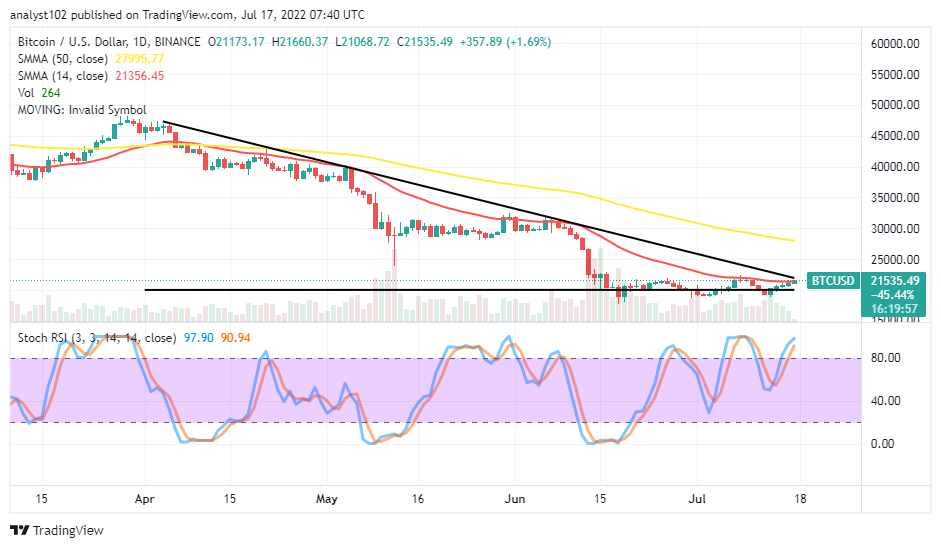
BTC/USD – Daily Chart
The BTC/USD daily chart showcases the crypto-economic price is hovering at $21,500. The 14-day SMA trading indicator is at a $21,356 value line underneath the 50-day SMA indicator. The horizontal line remains drawn at the $20,000 level marking the critical spot against any correction that can feature in no time. The Stochastic Oscillators are in the overbought region, seemingly attempting to close the lines within. The bearish trend line is at $21,725, closely over the trend line of the smaller SMA, showing the logical resistance point price needs to break sustainably to achieve a higher value in the run.
As there has been an overbought reading condition in the BTC/USD trade, will it be able to surge higher?
Presently, the BTC/USD market price is hovering at $21,500 closely, around the trend line of the 14-day SMA. Bulls, at the moment, will have to consolidate their stances over the $20,000 level to push more through variant resistances in the following sessions. In heightening the forces to the upside, the crypto economy will have to contend with a higher-trading resistance spot around the 50-day SMA trend line at $27,995 afterward.
On the downside of the technical analysis, a reversal in the current price motion against the smaller SMA will possibly lead the market down back against the $20,000 critical point. A further forceful breach of it to the downside will cause the trading condition to revisit some of its former lows around the support of the $17,500. For an early observation of when price may revert to a downward trending move, use 1-hour and 4-hour charts when there is a correspondence of overbought reading condition between them before considering launching a sell order. 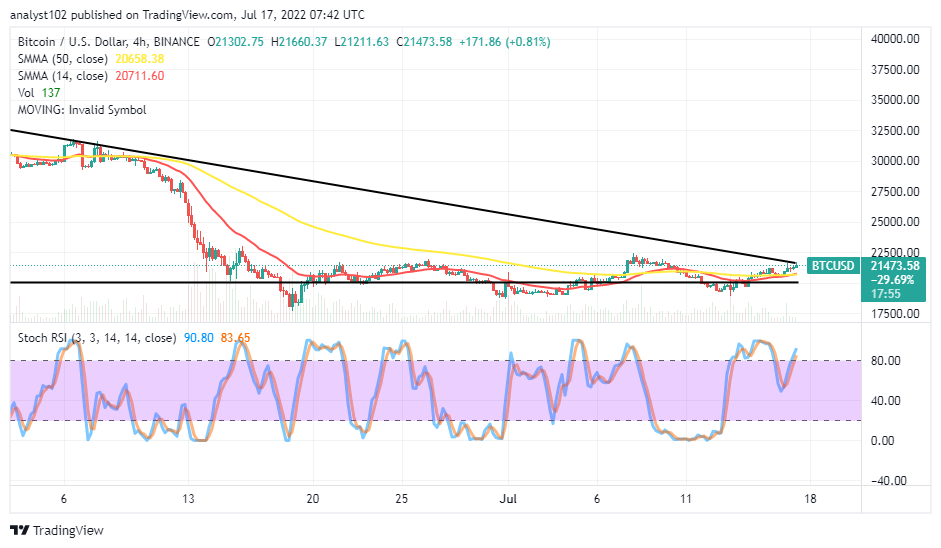
BTC/USD 4-hour Chart
The BTC/USD medium-term chart reveals the crypto-economic price is hovering at $21,500 above the trend lines of the SMAs. The 14-day SMA indicator has briefly intercepted the 50-day SMA indicator. The bearish trend line drew southward to markdown the area price has been struggling to push northward below the resistance of $22,500. The Stochastic Oscillators have briefly moved into the overbought region. It is that bears are getting repositioned to grab the charge of the market soon beneath the resistance value line mentioned earlier. A bearish candlestick needs to occur to confirm the probable validity of that assumption before the launching of any sell order afterward.
Note: Cryptosignals.org is not a financial advisor. Do your research before investing your funds in any financial asset or presented product or event. We are not responsible for your investing results.
“Lucky is up more than 50% today but still more than 430% from All Time Highs!
The opportunity to bank BIG is now!
You can purchase Lucky Block here. Buy LBlock