Quant Price Prediction: QNT/USD Turns Lower; Price Could Press Higher
Estimated Reading Time: 3 minutes
Don’t invest unless you’re prepared to lose all the money you invest. This is a high-risk investment and you are unlikely to be protected if something goes wrong. Take 2 minutes to learn more
Quant Price Prediction – December 22
The Quant price prediction shows that QNT will begin to form higher as the coin aims for a bullish movement.
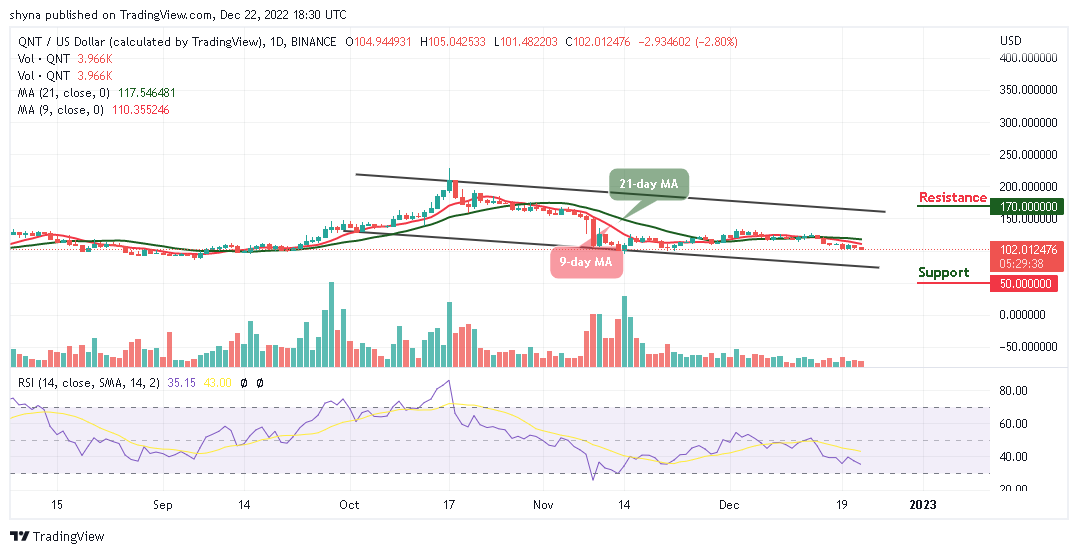
QNT/USD Medium-term Trend: Bearish (1D Chart)
Key Levels:
Resistance levels: $170, $190, $210
Support levels: $50, $30, $10
QNT/USD is sliding below the 9-day and 21-day moving averages as the coin heads toward the lower boundary of the channel. The market price is hovering at $102 and the Quant price may retreat more to allow new investors to come into focus.
Quant Price Prediction: QNT/USD Will Break to the Upside
The Quant price will begin to trade bullishly if it breaks above the 9-day and 21-day moving averages. At the time of writing, the coin is likely to touch the nearest support at $100 before crossing above the 9-day and 21-day moving averages. However, any further bullish cross above the upper boundary of the channel could push the coin to the potential resistance levels of $170, $190, and $210.
Nonetheless, the bullish movement may not play out if the sellers increase the selling pressure, and crossing below the lower boundary of the channel could hit the support levels of $50, $30, and $10. Similarly, the technical indicator Relative Strength Index (14) is below the 40-level, preparing the coin for the bullish movement.
QNT/USD Medium-term Trend: Ranging (4H Chart)
According to the 4-hour chart, the Quant price will increase if the coin crosses above the 9-day and 21-day moving averages. Currently, the Quant price is hovering around $101.82. Meanwhile, the long-term moving averages will begin the bullish movement as the market prepares for a new trend.
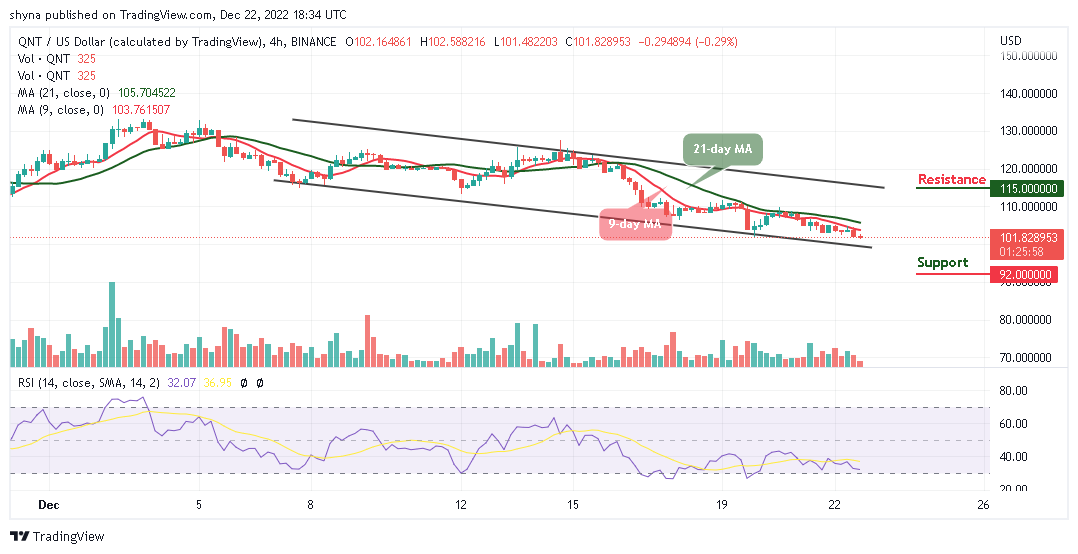
However, if the buyers push the price above the 9-day and 21-day moving averages, higher resistance could be reached at $115 and above as the technical indicator Relative Strength Index (14) hovers below the 35-level. Moreover, if the bulls fail to move the current market value to the upside, the bears may increase the pressure, and the nearest support level could be at $92 and below.
Place winning Quant trades with us. Get QNT here