Compound (COMP/USD) Bulls Eye $70 Support Level
Estimated Reading Time: 2 minutes
Don’t invest unless you’re prepared to lose all the money you invest. This is a high-risk investment and you are unlikely to be protected if something goes wrong. Take 2 minutes to learn more
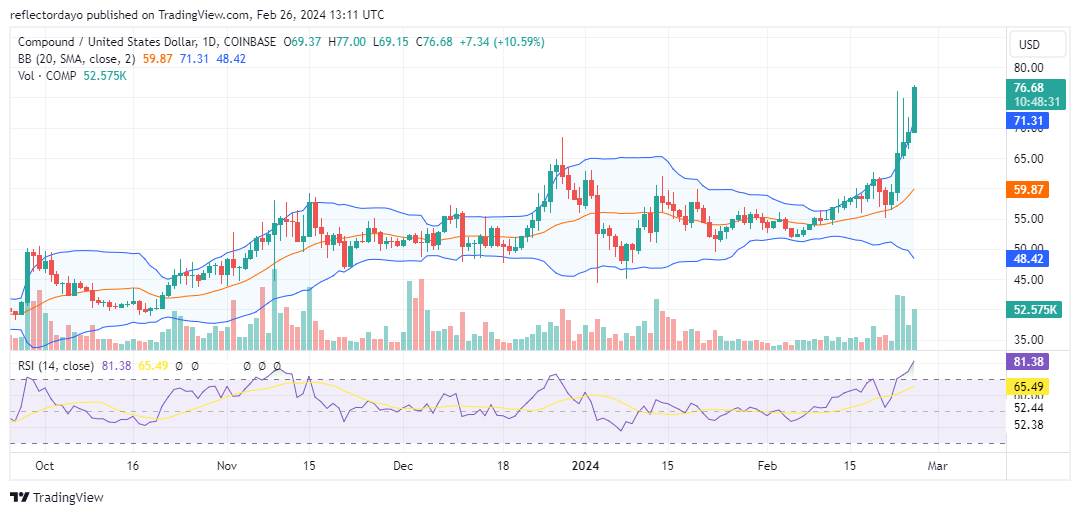
A significant breakout to the upside followed the convergence of the support and resistance levels that began at the start of the year. The Compound market commenced its upward movement on February 10th, gaining further momentum on February 22nd after establishing a strong support level at $56.92. Given the current surge in bullish market activity, traders should anticipate a potential trend reversal in the near future.
The Compound Market Data
- COMP/USD Price Now: $76.61
- COMP/USD Market Cap: $619 million
- COMP/USD Circulating Supply: 8.1 million
- COMP/USD Total Supply: 1.1 billion
- COMP/USD CoinMarketCap Ranking: #115
Key Levels
- Resistance: $80.00, $85.00, and $90.00.
- Support: $65.00, $60.00, and $55.00.
The Compound Market Analysis: The Indicators’ Point of View
The current bullish market is underpinned by robust trading volume histograms, indicating prevalent bullish sentiment. While the potential for a trend reversal exists due to the RSI line already residing comfortably in the overbought territory and the significant divergence in the Bollinger Bands indicator, bulls may find support at the $70 mark to sustain the upward trend. However, Compound investors should exercise patience and await confirmation, ensuring that price action remains steady at the $70 level and that the lower band of the Bollinger Bands also follows an upward trajectory before initiating a long trading position. Failure to maintain the $70 price level could trigger a substantial bearish correction in market dynamics.
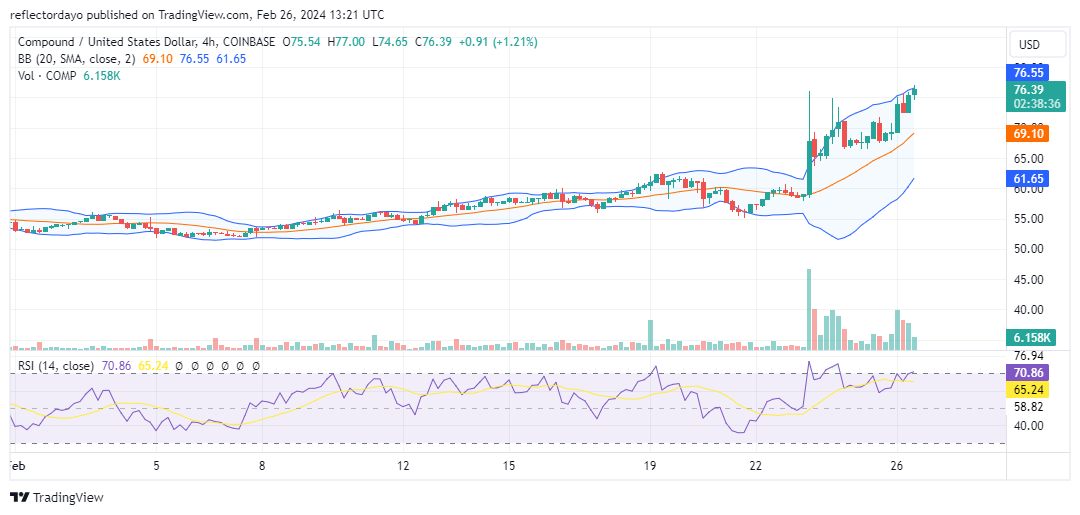
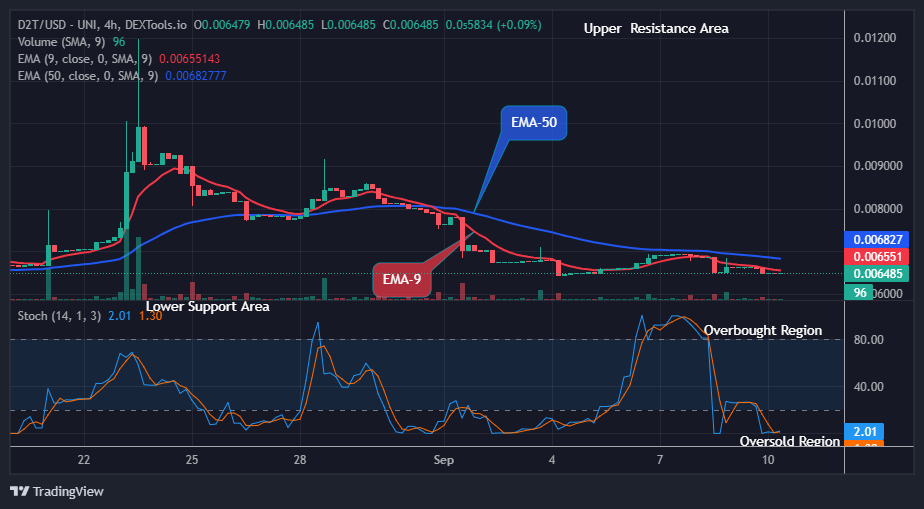
COMP/USD 4-Hour Chart Outlook
Based on the crypto signal from the 4-hour chart analysis of the market, it’s evident that the Bollinger Bands indicator has depicted an upward trending price channel, with a pronounced bandwidth indicating significant volatility. However, as the market surpasses the $75 level, the bullish momentum appears to be waning, signaling a potential correction in the market’s trajectory. When the correction materializes, the $70 mark can be a possible bullish support.