Cartesi (CTSI/USD): Bullish Momentum Diminishes as Price Nears April 19, 2023 Resistance Level
Estimated Reading Time: 2 minutes
Don’t invest unless you’re prepared to lose all the money you invest. This is a high-risk investment and you are unlikely to be protected if something goes wrong. Take 2 minutes to learn more
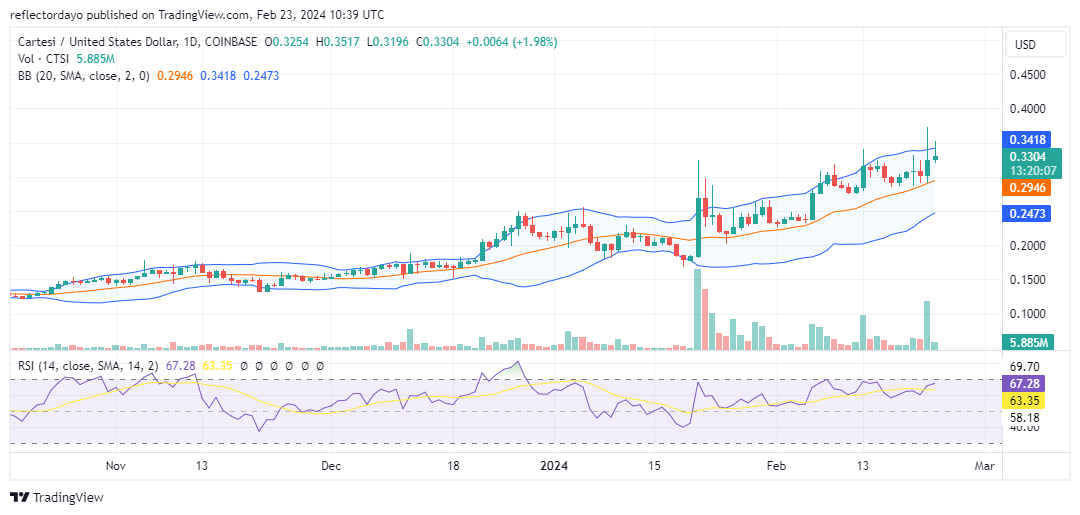
The Cartesi market has sustained continuous bullish momentum, experiencing significant gains since its decisive breakout from the ranging trend on January 21. Although the bull market encountered some bearish activities along the way, the prevailing bullish sentiment has persistently pulled the market upward. However, as the market nears the critical resistance level of $0.35 on April 19, 2023, the strength of the bullish momentum is diminishing, raising the possibility of a correction.
The Cartesi Market Data
- CTSI/USD Price Now: $0.33
- CTSI/USD Market Cap: $255 million
- CTSI/USD Circulating Supply: 779 million
- CTSI/USD Total Supply: 1 billion
- CTSI/USD CoinMarketCap Ranking: #229
Key Levels
- Resistance: $0.35, $0.40, and $0.45.
- Support: $0.25, $0.20, and $0.15.
The Cartesi Market Analysis: The Indicators’ Point of View
The emergence of an inverted hammer at the peak of the trend suggests a potential reversal towards a bearish trajectory. Earlier today, the Cartesi market experienced a significant surge upward, yet the trading volume, indicated by a short-height histogram, hinted at the lack of sustainability in this bullish move. This crypto signal suggests that the initial bullish momentum observed earlier today was unsustainable, as proven by subsequent developments. There is a possibility that the price may reverse at a lower peak compared to previous peaks in 2023. However, if this doesn’t occur, considering the decline in bullish strength, it’s unlikely that the market will surpass the crucial $0.35 price level.
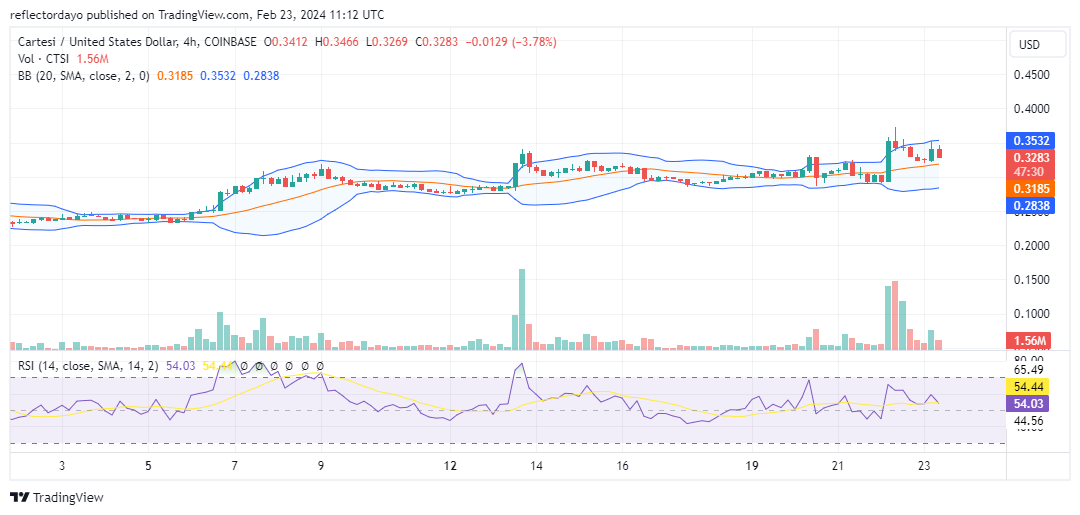
CTSI/USD 4-Hour Chart Outlook
From a shorter timeframe perspective, investors should monitor the $0.32 support level closely. There appears to be bullish interest around this level, as bullish forces have been resisting pressure here. However, the consistent appearance of inverted hammers indicates a gathering bearish momentum, suggesting a potential market breakdown. Once the critical $0.32 support level is breached, the market is likely to experience a significant decline.