Band Protocol (BANDUSD) Slumps Downward After a Head-And-Shoulders Formation
Estimated Reading Time: 3 minutes
Don’t invest unless you’re prepared to lose all the money you invest. This is a high-risk investment and you are unlikely to be protected if something goes wrong. Take 2 minutes to learn more
Band Analysis – The Market Engages a Head-And-Shoulders Formation and Slumps Downward
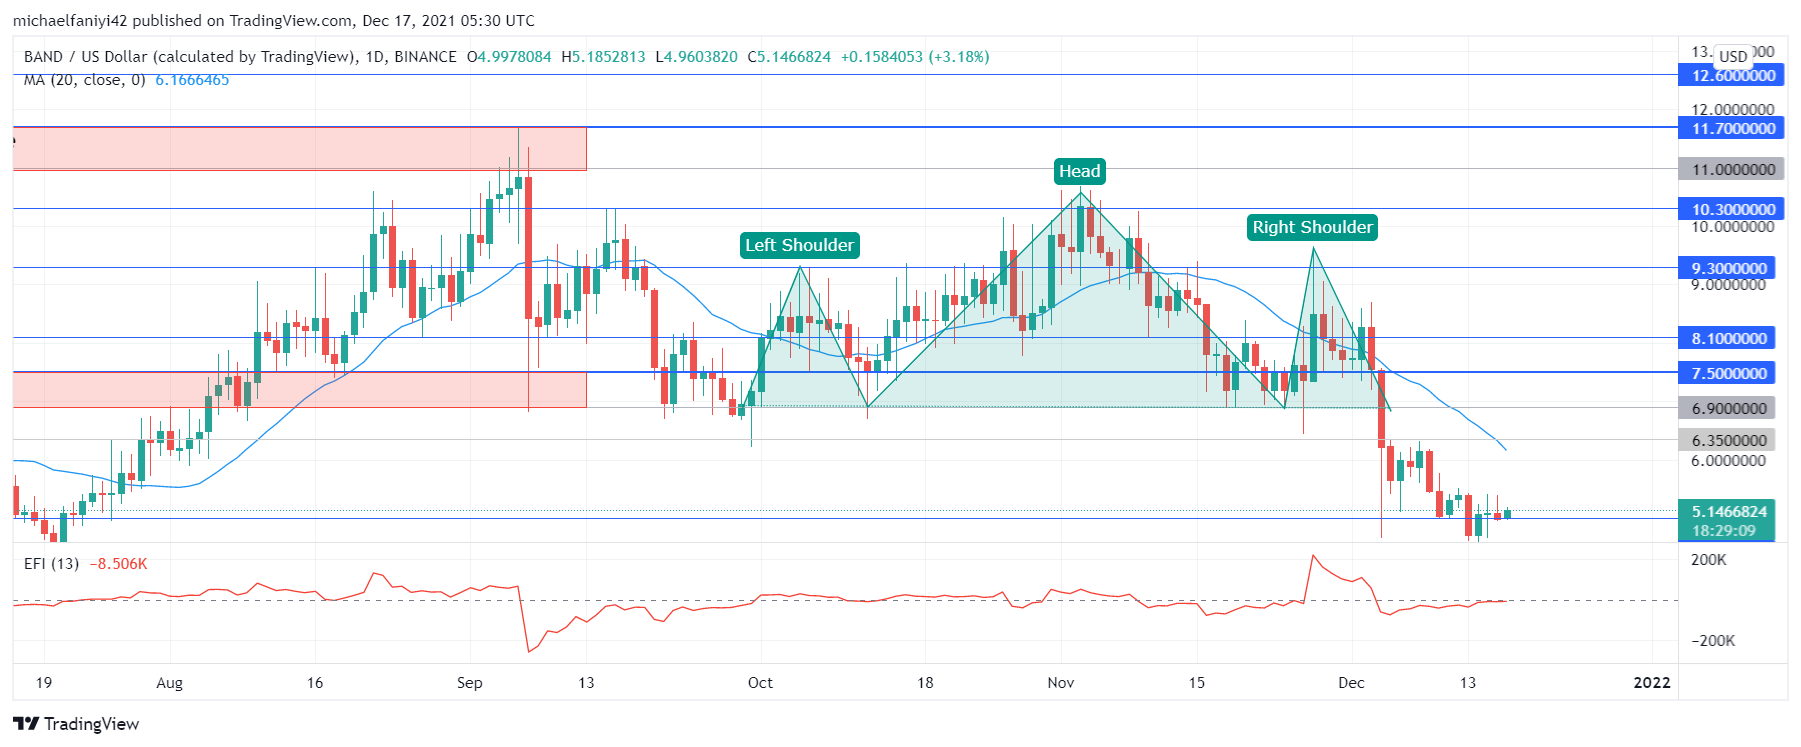
BAND slumps downward towards $4.200 after it engages in a head-and-shoulders formation. The last shoulder in the formation was formed after the coin recovered from its fluctuating state at the $7.500 level. This made the price rise till the wick of the daily candles touched $9.300, which is the highest point of the first shoulder as well. From there, the price crashes back against $7.500 and eventually slumps below it.
BAND Significant Levels
Resistance Levels: $9.300, $10.300, $11.700
Support Levels: $4.200, $5.000, $7.500
The $7.500 significant level is very critical for the coin, as it acts as a transition zone for upward and downward movement in the market. After a first failed trial, BAND finally crossed it upward on the 10th of August to transition to a higher market phase zone. The bullish impulse, therefore, continued till the coin found sharp resistance at $11.700, another transition zone. The price then slumps back to the $7.500 transition zone.
A renewed effort from the bulls led to the formation of the left shoulder in the head-and-shoulders pattern. Reduced bullish strength means the price slumps at $9.300. Increased vigor sees the coin rise to around $10.300 before it drops again, and from there, a weakened strength sees the formation of the right shoulder before the market finally slumps downward beyond the $7.500 transition level.

Market Prospects
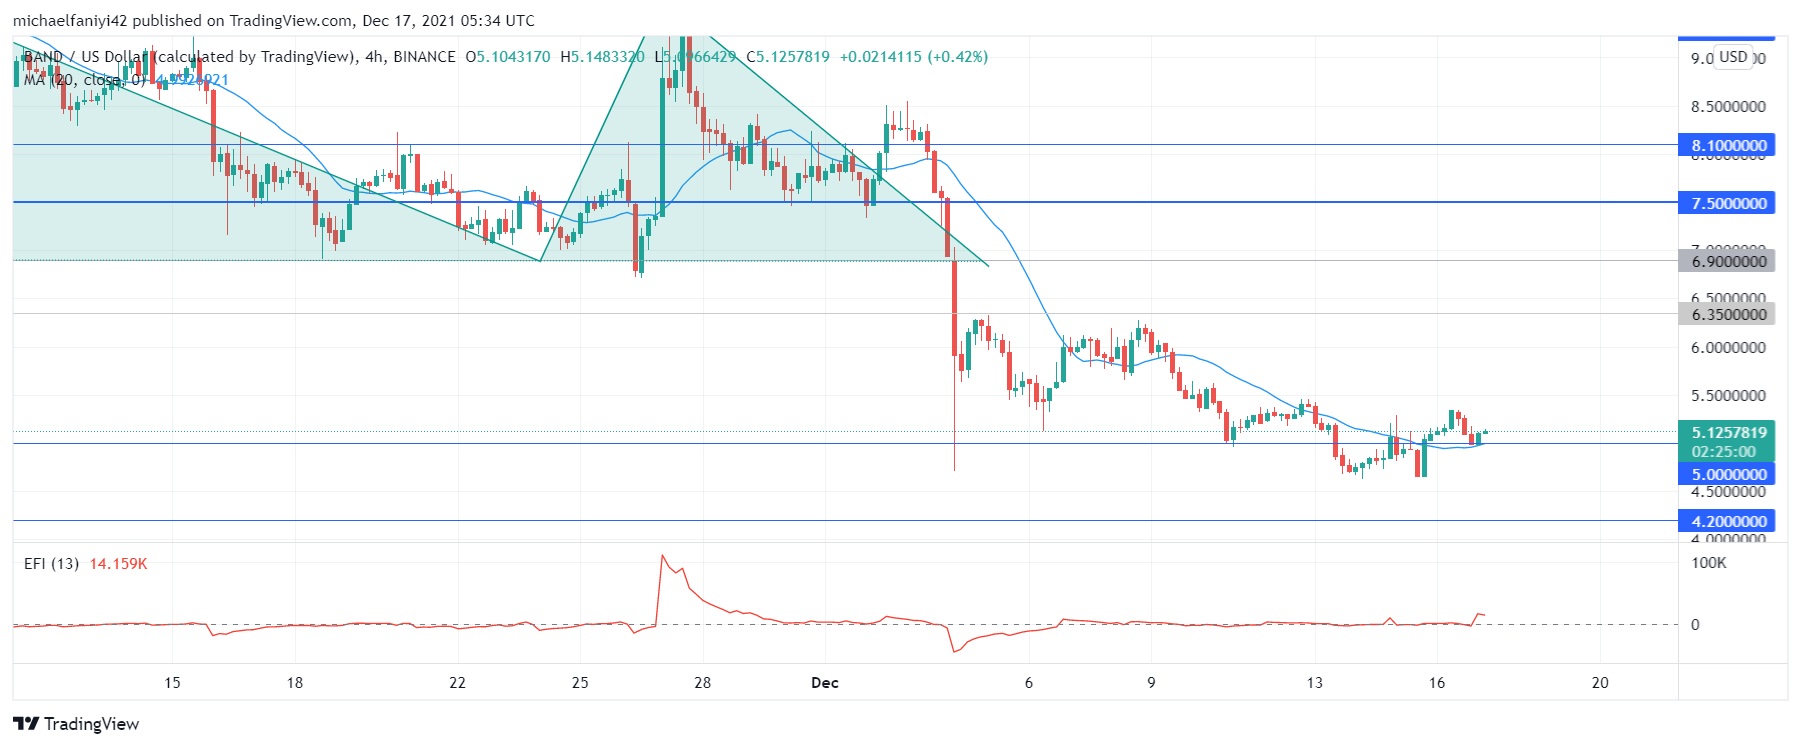
On the 4-hour chart, the coin can be seen continually pushing itself against the $5.000 significant level, which is the last major level before the price drops to where it started from at $4.200. The buyers are putting in their best efforts to prevent further drops in the market, the EFI (Elders Force Index) remains undulating at the zero level and swaying occasionally into a positive value. The confluence of the MA period 20 (Moving Average) and $5.000 is the last support for the market before it breaks towards $4.200.
You can purchase crypto coins here: Buy Tokens
Note: Cryptosignals.org is not a financial advisor. Do your research before investing your funds in any financial asset or presented product or event. We are not responsible for your investing results.