Bitcoin (BTC/USD) Price Trades at $65,000 Level
Estimated Reading Time: 3 minutes
Don’t invest unless you’re prepared to lose all the money you invest. This is a high-risk investment and you are unlikely to be protected if something goes wrong. Take 2 minutes to learn more
Bitcoin Price Prediction – November 14
The current BTC/USD market trading situation reveals that price trades at $65,000 in a more or less ranging style. The crypto-economic market experiences a trading volume of about $64,574 as of writing, keeping the pace of a smaller negative percentage rate of around 0.26. That signifies that the current slight motion in the price experiences a depression.
BTC/USD Market
Key Levels:
Resistance levels: $67,500, $70,000, $72,500
Support levels: $62,500, $60,000, $57,500
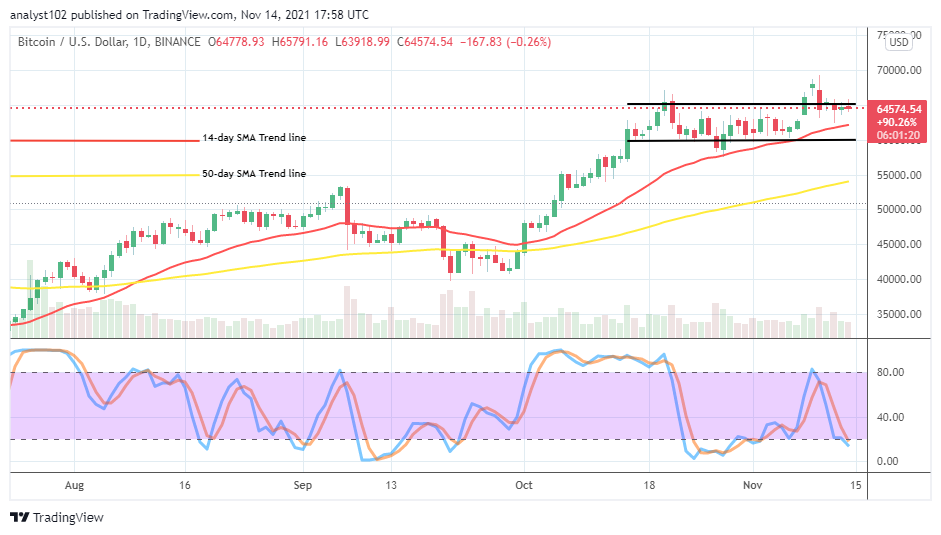
BTC/USD – Daily Chart
The BTC/USD daily chart showcases that the crypto-economic price trades at the $65,000 level in the manner of ranging outlook. The 50-day SMA trend line is underneath the 14-day SMA trend line. The range-bound trend lines drew at higher zones to enclose the smaller SMA indicator at the tail end. The Stochastic Oscillators have slightly moved past the range of 20 into the oversold region. That suggests that the downward pressure isn’t weighty for sustainability at this point.
Will the BTC/USD market find breaking down further difficult as the crypto-economic price trades at the $65,000 level?
It seemingly indicated that the current downward pressures by the BTC/USD market are not that strong to portend a long-holding of downward trend returning in the near time as the crypto-economic price trades at the $65,000 level. Some necessary corrections may have to emerge between the levels of the value line mentioned earlier and the $60,000 to let bulls find support. In the light of that, long position takers are to be on the lookout while that assumption comes to play.
On the downside, the BTC/USD market bears appear to have exhausted their capacity to violently reverse the uptrend, down beneath some of the higher psychological trading levels that the market is still keeping until the present. It currently indicated that selling forces are gradually heading into an early oversold condition that can cause an unnecessary bearish trap for wanting to go short further without a significant signal backing it under the current less-active price motions.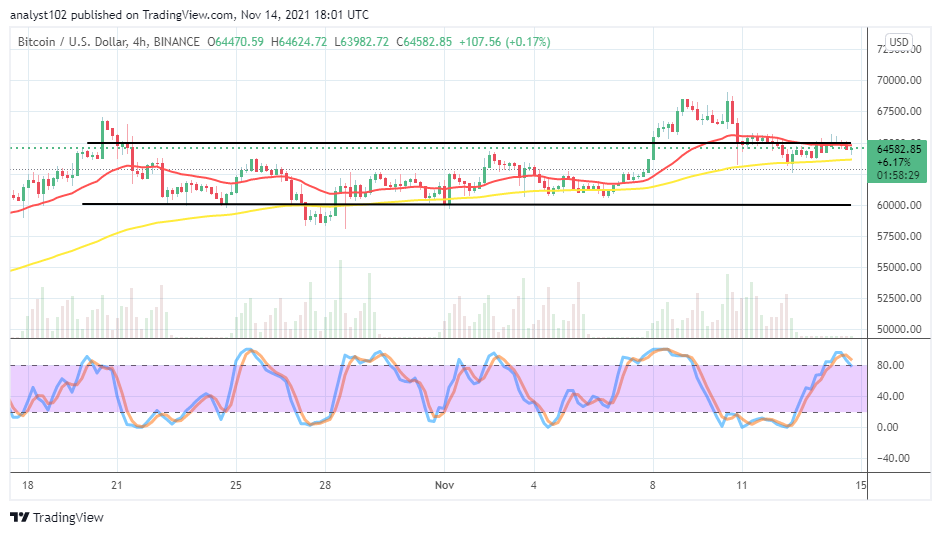
BTC/USD 4-hour Chart
The BTC/USD medium-term chart showcases that the crypto-economic price trades at the $65,000 level in a ranging format. Three lines are involved in the current market’s range-bound trading formation, such as the point earlier mentioned, the $62,500 and the $60,000. The 14-day SMA is around the upper range value-line above the 50-day SMA. The Stochastic Oscillators are in the overbought region, with the lines briefly crossed southbound to touch the range of 80. That signifies the possibility that the US fiat currency may drag the market back downward in a correctional mode afterward.
Note: Cryptosignals.org is not a financial advisor. Do your research before investing your funds in any financial asset or presented product or event. We are not responsible for your investing results.
You can purchase crypto coins here. Buy Tokens