POL (prev. MATIC) Price Prediction: POL/USDT Bulls Are Looking Cautious
Estimated Reading Time: 3 minutes
Don’t invest unless you’re prepared to lose all the money you invest. This is a high-risk investment and you are unlikely to be protected if something goes wrong. Take 2 minutes to learn more

Date: August 16, 2025
The POL (previously MATIC) coin seems to have solidly surpassed the $0.2000 price level. This development appears to have taken place after price action rebounded from the $0.1900 support level. Although recent sessions have not been significantly profitable, bullish forces still seem to have a fair chance of remaining in control.
POL/USDT Long-Term Trend — Bullish (Daily Chart)
Key Price Levels:
Resistance: $0.2500, $0.3000, $0.3250
Support: $0.2300, $0.2000, $0.1900
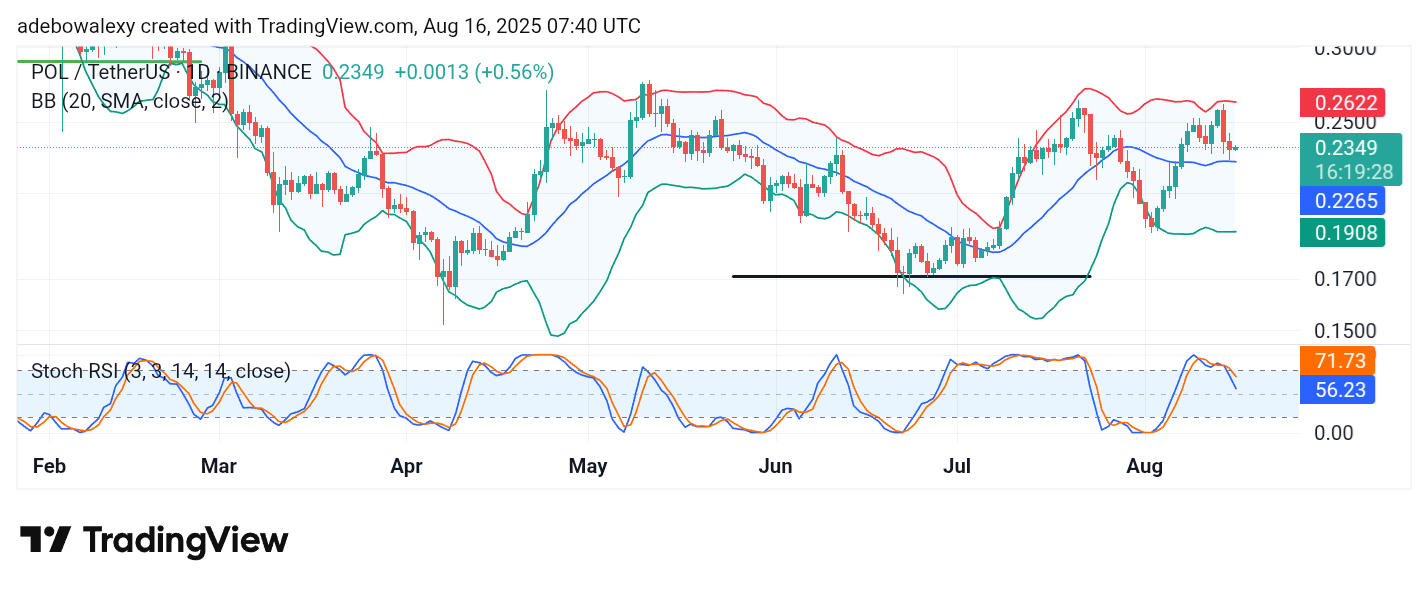
The ongoing session has presented only minimal gains. This is reflected in the appearance of a small green candle above the middle band of the Bollinger Bands (BB) indicator. The BB indicator itself remains well-expanded, leaving room for potential upward rebounds. However, the Stochastic Relative Strength Index (SRSI) indicator lines are now descending toward the 50 level.
POL/USDT Price Prediction: POL (prev. MATIC) Bullish Gains Look Threatened
Although the current session’s price candle reflects modest increases in the POL (prev. MATIC) , technical indicators seem to suggest an opposite bias.
On the daily chart, the last price candle stands above the middle band of the BB indicator, while the outer bands remain widely spread. However, despite this setup, the SRSI indicator lines continue to descend steadily.
The indicator’s terminals appear divergent, suggesting that bearish momentum is strengthening. Should price action fall below the middle band of the BB indicator, the market may revisit lower support levels.
POL/USDT Price Prediction: POL (prev. MATIC) Upward Rebound Weakens (4-Hour Chart)
On the POL (prev. MATIC) 4-hour chart, it is clear that price action recently rebounded off the support at the lower band of the BB indicator. However, as trading progresses through subsequent sessions, bullish momentum appears to be weakening.
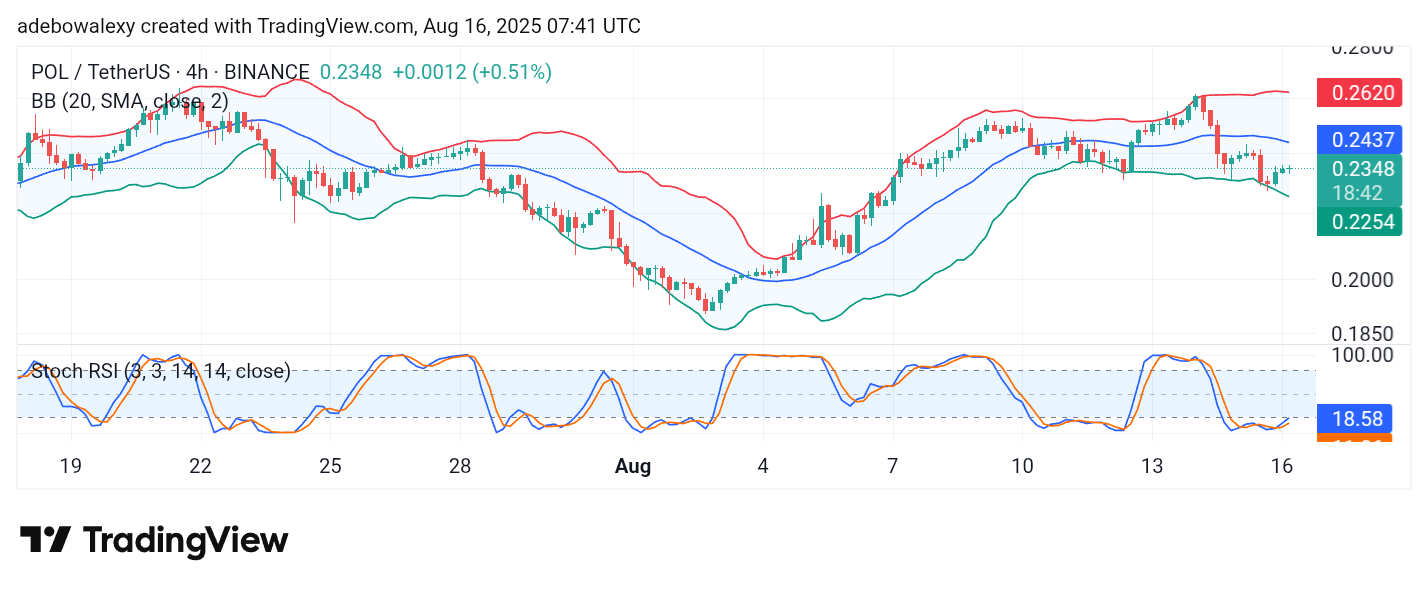
As a result, the latest price candle on this chart is relatively small. Additionally, the SRSI indicator lines are currently in the oversold region, though the terminals of the indicator show an upward trajectory from deep within the oversold area.
In the near term, the market seems to hold a bearish outlook toward the $0.2000 price level. However, in the longer term, the market still has the potential to climb toward $0.2750 and, more distantly, $0.3000.