$SPONGE (SPONGE/USD) Faces Bearish Test as Key Support Falters
Estimated Reading Time: 3 minutes
Don’t invest unless you’re prepared to lose all the money you invest. This is a high-risk investment and you are unlikely to be protected if something goes wrong. Take 2 minutes to learn more

The recent market-wide crypto downturn has dragged $SPONGE below its crucial $0.000104 support—a level many expected to trigger a bullish rebound. Instead, the breakdown reveals waning buyer strength, raising questions about the sustainability of the previous uptrend.
However, the sell-off lacks conviction. The sluggish downside momentum suggests bears aren’t fully in control, leaving the door open for a potential reversal if bulls defend lower supports. While the breach of $0.000104 is technically bearish, the absence of aggressive selling in the crypto signal hints at accumulation near current lows, setting the stage for a possible recovery.
Critical Levels to Watch
- Resistance: $0.000115, $0.000120 $0.000130
- Support: $0.000090 , $0.000085, $0.000080
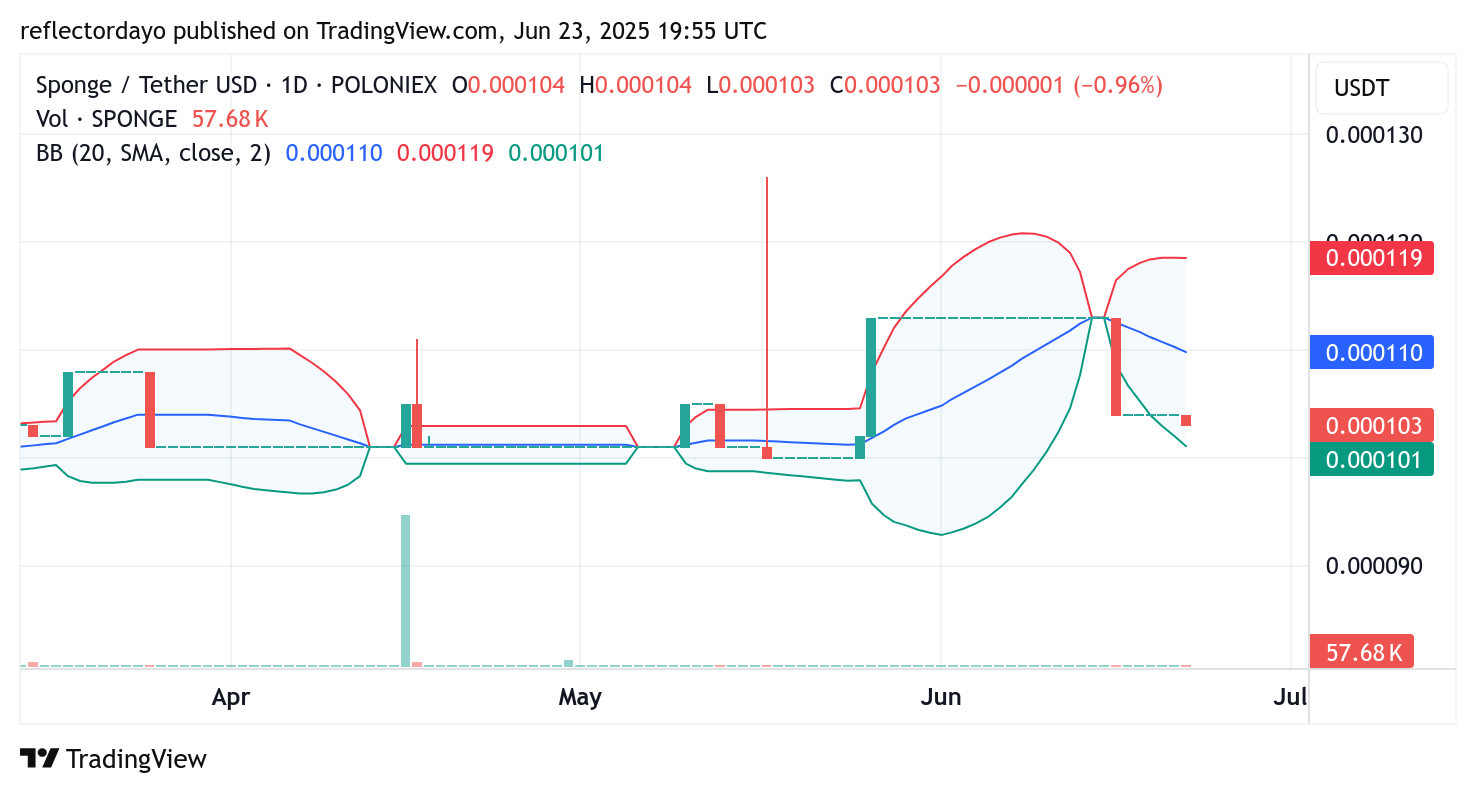
Daily Chart: Volatility Holds as $SPONGE Tests Oversold Territory
The daily chart shows Bollinger Bands remaining wide, reflecting persistent volatility after $SPONGE’s drop below $0.000104. Currently hovering near $0.000103, the asset is flirting with oversold conditions—a scenario that often precedes short-term bounces.
Notably, trading volume remains anemic, signaling limited seller enthusiasm. This lack of follow-through suggests the breakdown may lack staying power. If buyers step in at these levels, a consolidation phase could unfold before the next directional move.
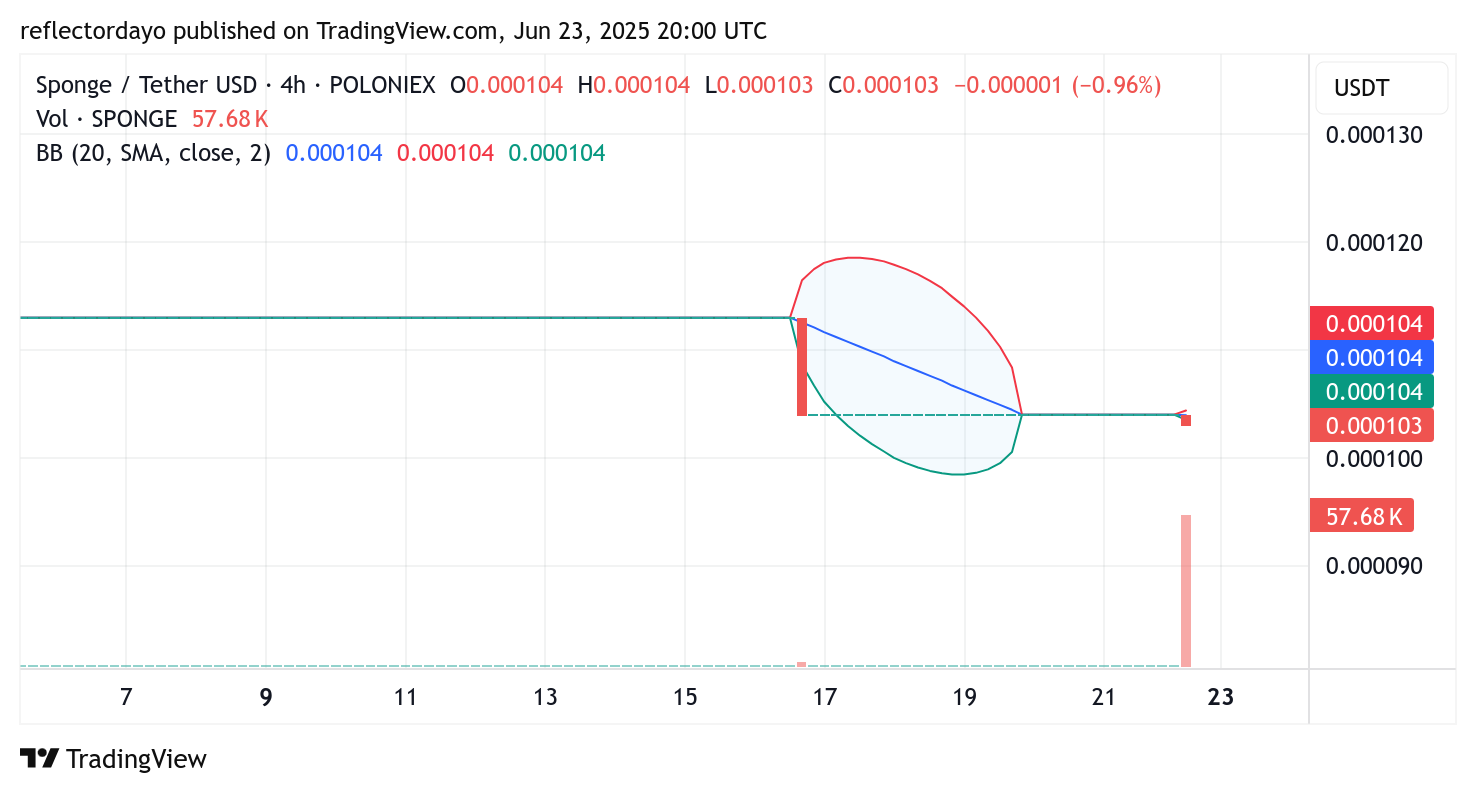
SPONGE/USD 4-Hour Chart: Silent Bullish Divergence Emerges
The 4-hour timeframe reveals an intriguing development: a volume spike coinciding with minimal price decline near $0.000103. This divergence implies stealthy accumulation, as buyers absorb sell orders without triggering a sharp rebound—yet.
Such activity often precedes bottoming patterns. If this support holds, SPONGE/USD may enter a compression phase before attempting to reclaim $0.000104. Traders should monitor for:
-
Increasing bid liquidity at current levels
-
A volume-backed push above $0.000104 to confirm bullish revival
Buy $SPONGE!
Bro selling everything to buy the dip pic.twitter.com/z2QVtqR8rt
— $SPONGE (@spongeoneth) June 19, 2025
Join the SPONGE community and get in on the next big crypto opportunity! Buy Sponge ($SPONGE) today