Bitcoin (BTC/USD) Price Predominantly Features Around $20,000
Estimated Reading Time: 3 minutes
Don’t invest unless you’re prepared to lose all the money you invest. This is a high-risk investment and you are unlikely to be protected if something goes wrong. Take 2 minutes to learn more
Bitcoin Price Prediction – November 2
Variant ups and downs in the BTC/USD market operations have been that the crypto-economic price predominantly features around the $20,000 trading line. At the $20,493.48 trading mark, the percentage rate of trade has slightly decreased to 0.01 adversely.
BTC/USD Market
Key Levels:
Resistance levels: $22,500, $25,500, $27,500
Support levels: $17,500, $15,000, $12,500
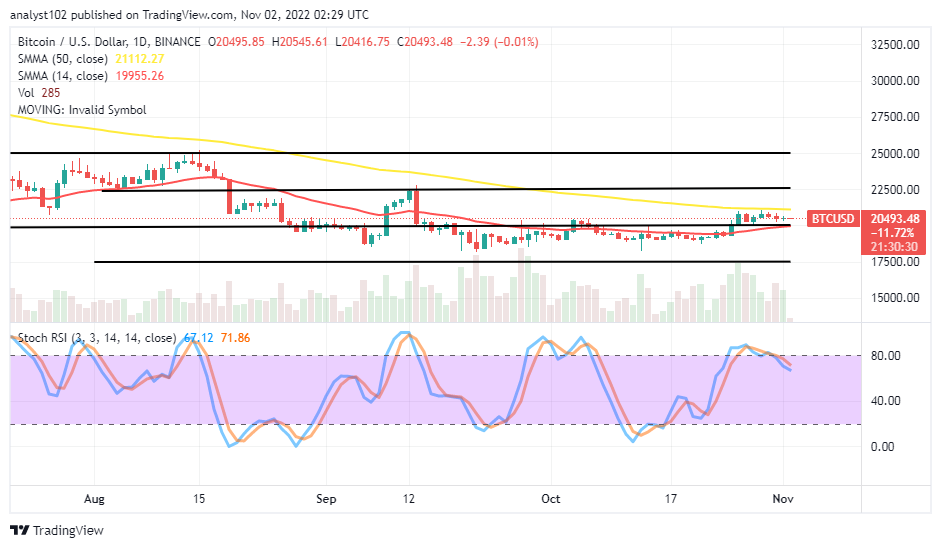
BTC/USD – Daily Chart
The daily chart pictures that the BTC/USD market price predominantly features around the $20,000 ever psychological point since the activities entered a downward-trending cycle this year. The 14-day SMA indicator has been at $19,955.26, underneath the $21,112.27 value line of the 50-day SMA indicator. The trending outlook, so far, is kept between the $22,500 and $17,500 values over time. The Stochastic Oscillators have swerved briefly southbound after a short line of consolidation-moving manner to the tune of 71.86 and 67.12 range points.
Will a descending force below the 50-day SMA trend line eventually cause the BTC/USD market operation to collapse?
The 50-day SMA trend line will be crucial in determining the next direction in the BTC/USD market operations as the price predominantly features around the $20,000 logical trading spot. Currently, it appears that s descending force is compiling below the 50-day SMA indicator, around $21,112.27. Buyers will have to regroup for a second round of buying from a decline after the move might have exhausted afterward.
The downside of the BTC/USD technical analysis suggests that the market may experience a halt for a while around its current oscillating spot price. Therefore, in the process of that coming forth, an indecision trading condition will play out. A false pull-up toward the trend line of the bigger SMA will produce an avenue for sellers to leverage a shorting order alongside the market reversal motion.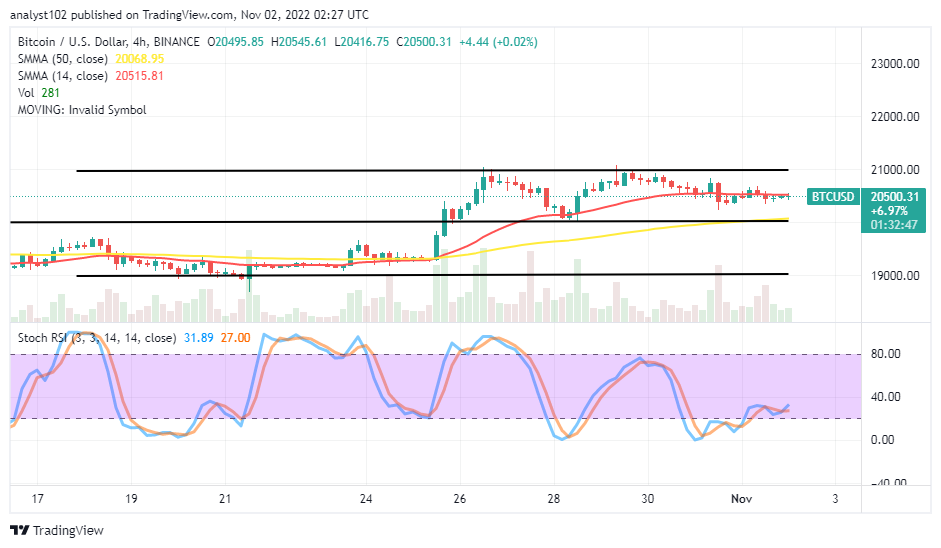 BTC/USD 4-hour Chart
The BTC/USD medium-term chart showcases the crypto trade price predominantly features in value lines of $20,000 and $21,000. Two range-bound layer spots are present in the market’s trending view on the way around. The 14-day SMA indicator is at $20,515.81 above the $20,068.95 value lines of the 50-day SMA indicator. The Stochastic Oscillators have traveled into the oversold region, swinging northbound lightly at 27.00 and 31.89 range values. The market has a limited trading capacity and is not suitable for trade.
Note: Cryptosignals.org is not a financial advisor. Do your research before investing your funds in any financial asset or presented product or event. We are not responsible for your investing results.
You can purchase Lucky Block here. Buy LBLOCK