Ripple Is in a Sideways Move as It Challenges the $0.40 High
Estimated Reading Time: 2 minutes
Don’t invest unless you’re prepared to lose all the money you invest. This is a high-risk investment and you are unlikely to be protected if something goes wrong. Take 2 minutes to learn more
Ripple (XRP) Long-Term Analysis: Bearish
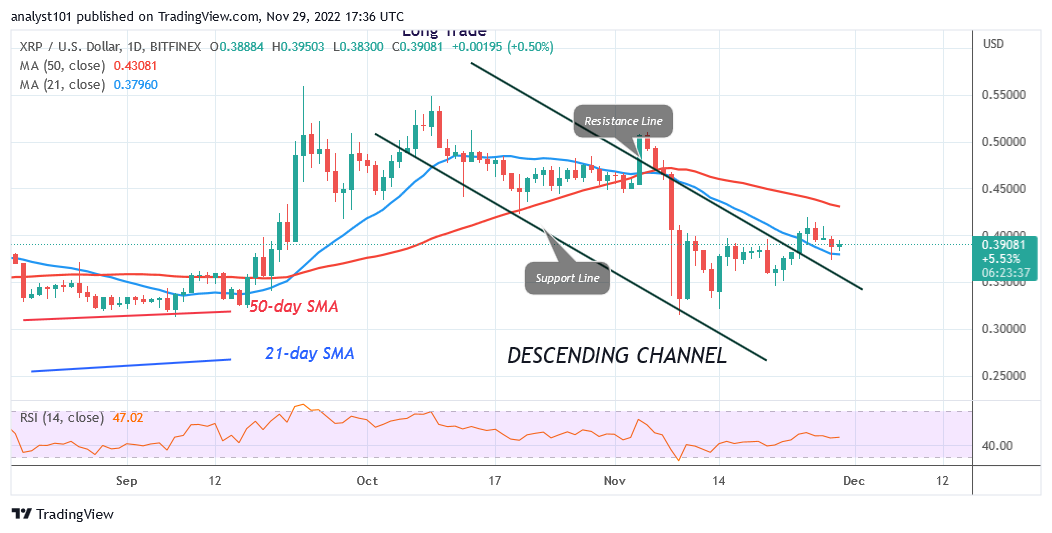
Ripple (XRP) crosses over the 21-day moving average lines as it challenges the $0.40 high. The cryptocurrency is currently pushing past the most recent high after being recently rejected at its record high of $0.40. If price breaks below the 21-day line SMA, the altcoin will fall to the range-bound region between levels of $0.31 and $0.40. But XRP will reach its previous highs if it trades over the 21-day line SMA. On the plus side, XRP will soar to its prior high of $0.55 if it breaks above the moving average lines. However, the coin will collapse and start a range-bound move between $0.31 and $0.40 price levels if it is rejected at the most recent high.
Ripple (XRP) Indicator Analysis
On the Relative Strength Index, Ripple is at level 47 for period 14. It is currently in the declining zone following the most recent rejection. The cryptocurrency will resume drifting sideways as long as it trades between the moving average lines. The slope of the 50-day line and the 21-day SMA both point to a downward trend. XRP is above level 60 on the daily Stochastic as it begins to go upward once more.
Technical indicators:
Major Resistance Levels – $2.00, $2.50, $3.00
Major Support Levels – $1.50, $1.00, $0.50
What Is the Next Direction for Ripple (XRP)?
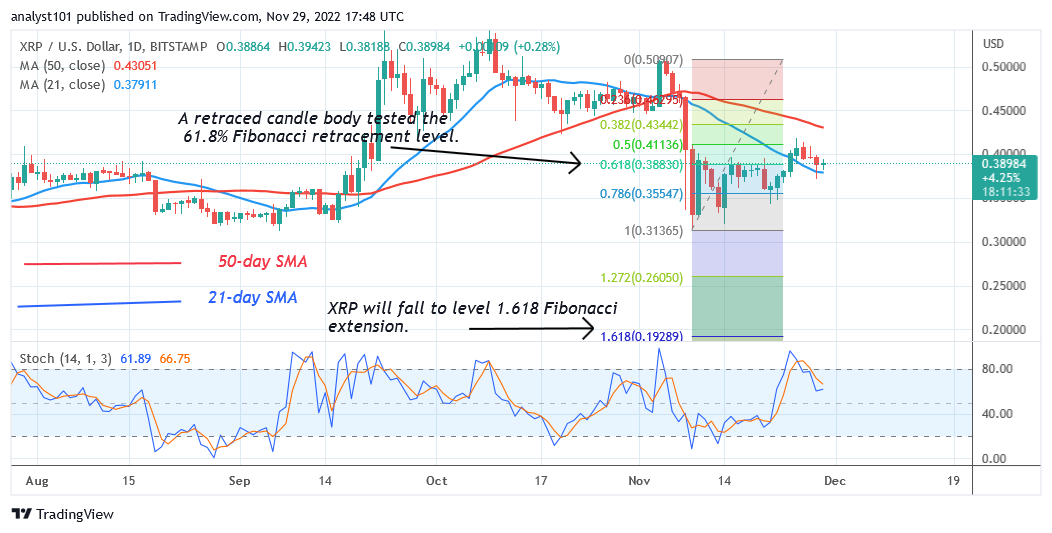
Ripple price is circling above the 21-day line SMA as it challenges the $0.40 high. The uptrend will begin if the price crosses the 50-day SMA. On the other hand, the range-bound motion will restart if the moving average lines fail to break through the most recent high.
You can purchase crypto coins here. Buy LBLOCK
Note: Cryptosignals.org is not a financial advisor. Do your research before investing your funds in any financial asset or presented product or event. We are not responsible for your investing results