Arbitrum Price Prediction: ARB/USD Reclaims $1.155 Resistance
Don’t invest unless you’re prepared to lose all the money you invest. This is a high-risk investment and you are unlikely to be protected if something goes wrong. Take 2 minutes to learn more

Arbitrum Price Prediction – June 30
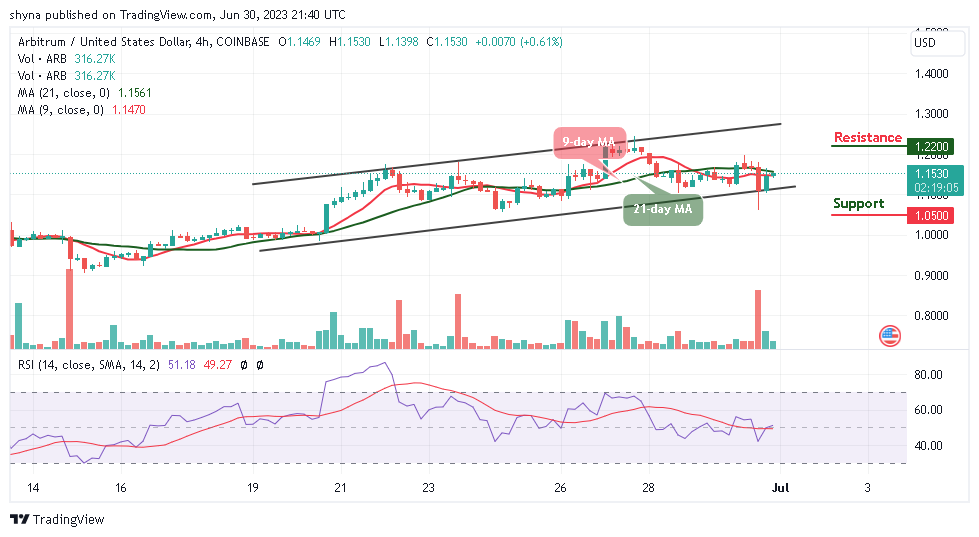
As the Arbitrum price prediction trades above $1.155, the bulls are ready to push the king coin to hit the resistance level of $1.200.
ARB/USD Long-term Trend: Ranging (4H Chart)
Key levels:
Resistance Levels: $1.220, $1.240, $1.260
Support Levels: $1.050, $1.030, $1.010

ARB/USD will follow a bullish movement as the coin gets ready to cross above the 9-day and 21-day moving averages. At the beginning of today’s trading, the Arbitrum price sees a steady rise towards the upside, and the Arbitrum price hits the daily high at $1.159.
Arbitrum Price Prediction: ARB Price Faces the Upside
The Arbitrum price is seen hovering within the 9-day and 21-day moving averages as the market price prepares to move to the upside. However, any bullish cross above the 21-day moving average will increase the current market value to reach the nearest resistance at $1.200. The buyers may locate the potential resistance levels at $1.220, $1.240, and $1.260 if the bulls put in more effort.
In the meantime, if the resistance level of $1.153 fails to hold, it may reverse and face the support level of $1.130, further increase in the bears’ pressure may bring down the price below the lower boundary of the channel, and this could cause the coin to hit the support levels at $1.050, $1.030, and $1.010 respectively. Moreover, the technical indicator Relative Strength Index (14) is moving in the same direction above the 50-level, suggesting sideways movement.
ARB/USD Medium-term Trend: Bearish (2H Chart)
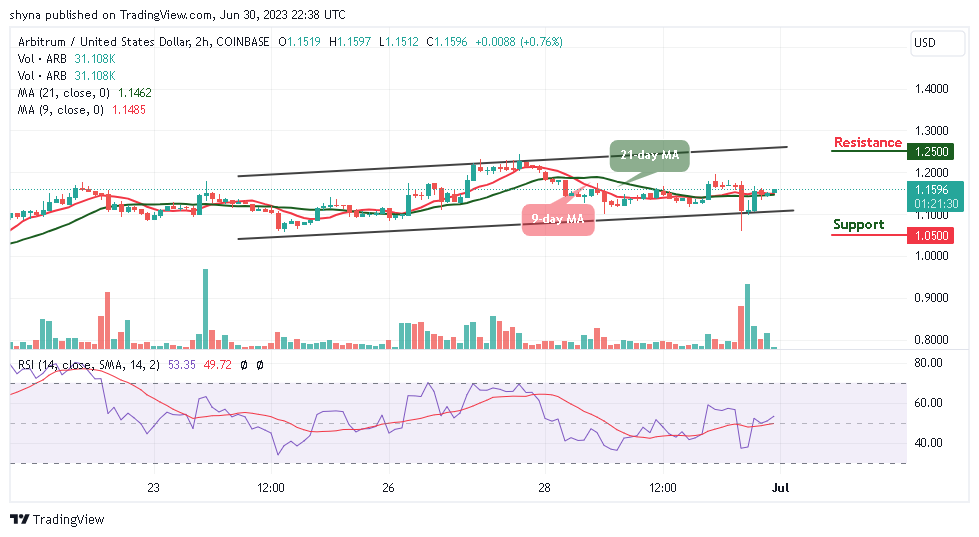
According to the 2-hour chart, the Arbitrum price is hovering above the 9-day and 21-day moving averages at $1.159. The bulls can push the price toward the upper boundary of the channel if they increase the buying pressure but any bearish movement below the moving averages could bring the coin to the support level of $1.050 and below.

Moreover, if the Arbitrum price finds a decent resistance level at $1.160 level, the Arbitrum price will head to the north, which could hit the resistance level of $1.250 and above. At the moment, the technical indicator Relative Strength Index (14) may continue to move sideways as the signal line moves above the 50-level.
Place winning Arbitrum trades with us. Get ARB here


