Cardano Hovers Above $0.35 as It Faces Rejection at $0.40
Estimated Reading Time: 2 minutes
Don’t invest unless you’re prepared to lose all the money you invest. This is a high-risk investment and you are unlikely to be protected if something goes wrong. Take 2 minutes to learn more
Cardano (ADA) Price Long-Term Forecast: Bearish
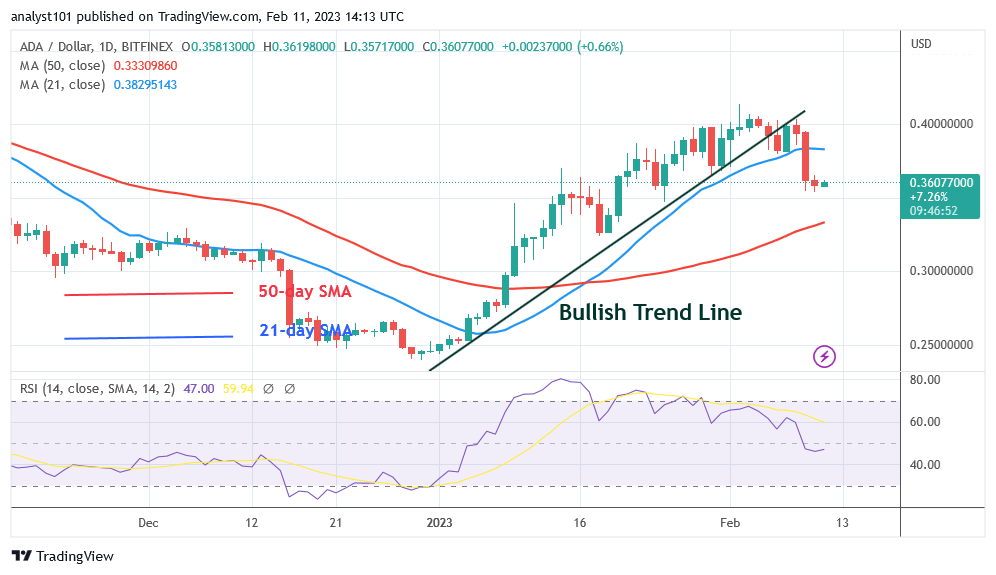
Cardano (ADA) falls below the 21-day line SMA as it faces rejection at $0.40. Since January 29, buyers have been frantically attempting to break through the resistance at $0.40. The bears broke below the 21-day line SMA on February 9 as the altcoin slid above the $0.35 support.There is less selling pressure over the $0.35 support. The moving average lines are where Cardano is now trading. The altcoin’s range-bound movement between the moving average lines will soon resume. If the price of Cardano rises above either the 21-day or 50-day SMA, the trend will restart. At the time of writing, ADA is currently trading for $0.36.
Cardano (ADA) Indicator Analysis
On the Relative Strength Index for period 14, Cardano is level 46. As it enters the bearish trend zone, the altcoin has the potential to tumble much more. Since the price bars are located between the moving average lines, the altcoin may start moving in a range-bound pattern. The daily Stochastic’s level 20 has been breached by the cryptocurrency. The oversold area of the market for the altcoin has been reached. In the oversold area, buyers will show up to drive prices up.
Technical indicators:
Major supply zones: $1.0, $1..05, $1.10
Major demand zones: $0.45, $0.40, $0.35
What Is the Next Move for Cardano (ADA)?
The price of Cardano is moving sideways as it faces rejection at $0.40
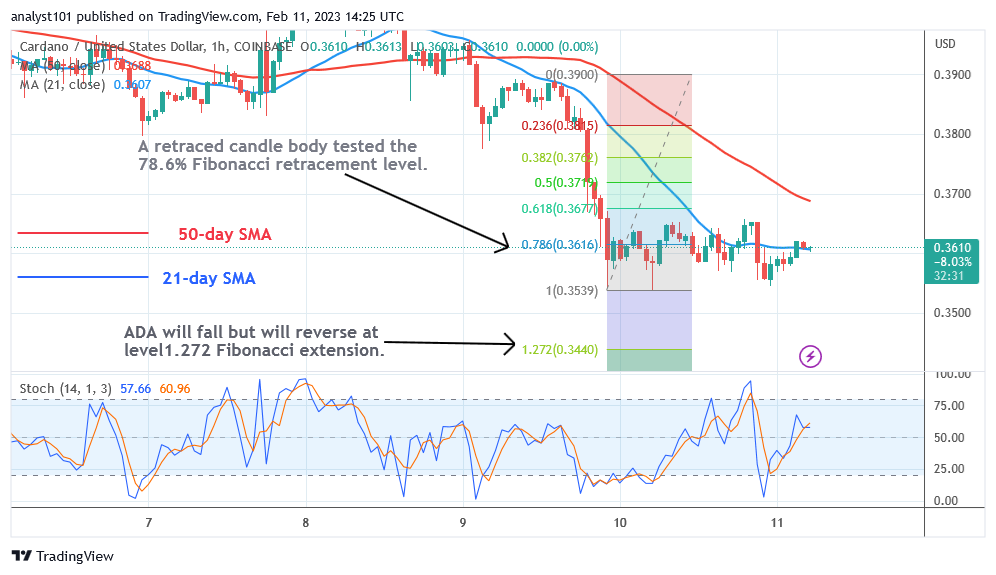
. If the altcoin is unable to rise above the moving average lines, it may see additional fall. A candle body that was part of the downward trend on February 9 by ADA tested the 78.6% Fibonacci retracement line. The correction suggests that ADA will decline, but that it will turn around at level 1.272 of the Fibonacci extension, or $0.344.
You can purchase crypto coins here. Buy LBLOCK
Note: Cryptosignals.org is not a financial advisor. Do your research before investing your funds in any financial asset or presented product or event. We are not responsible for your investing results