Tamadoge (TAMA/USD) Rallies, Approaching $0.0095 Mark
Estimated Reading Time: 3 minutes
Don’t invest unless you’re prepared to lose all the money you invest. This is a high-risk investment and you are unlikely to be protected if something goes wrong. Take 2 minutes to learn more

Leading up to late November, the TAMA/USD market exhibited fluctuations around the $0.008 price level. Bullish momentum emerged around $0.0077, effectively overcoming bearish pressure. During subsequent bearish retracements, bullish traders consistently intervened at higher support levels, steering the market towards the $0.0095 threshold. Presently, the bulls continue to drive prices higher, propelling the market to new heights in this bullish trend.
Key Levels
- Resistance: $0.013, $0.014, and $0.015.
- Support: $0.0075, $0.0073, and $0.007.
TAMA/USD Price Analysis: The Indicators’ Point of View
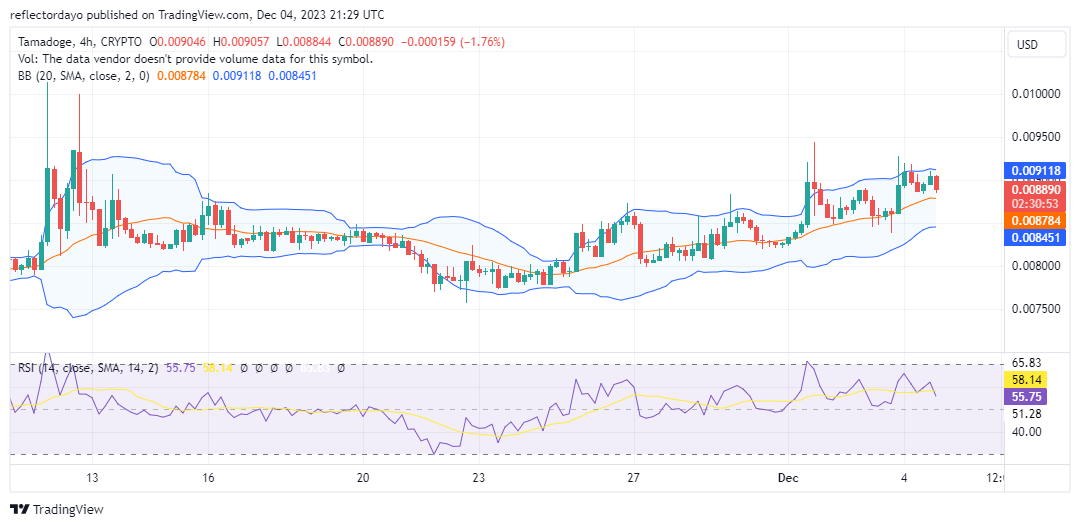
While bullish sentiment prevails in the market, it is important to acknowledge the presence of bears within this trend. Nevertheless, despite the bearish presence, TAMA/USD bullish traders demonstrate resilience by establishing higher lows, forming a pivotal foundation for the ongoing bullish trajectory. The current dominance of bulls is evident in the market, as reflected by the Bollinger Band depicting an upward-trending price channel. This trend persists even after an extended period of price consolidation around the $0.008 level.
Bulls have effectively managed retracements stemming from significant resistance points. In the current market scenario, there is a notable struggle between demand and supply at the $0.0090 price level. Considering the historical market performance and the prevailing bullish momentum, there is a likelihood that bulls may intervene at a level in close proximity to the $0.009 mark.
Tamadoge Short-Term Outlook: 1-Hour Chart
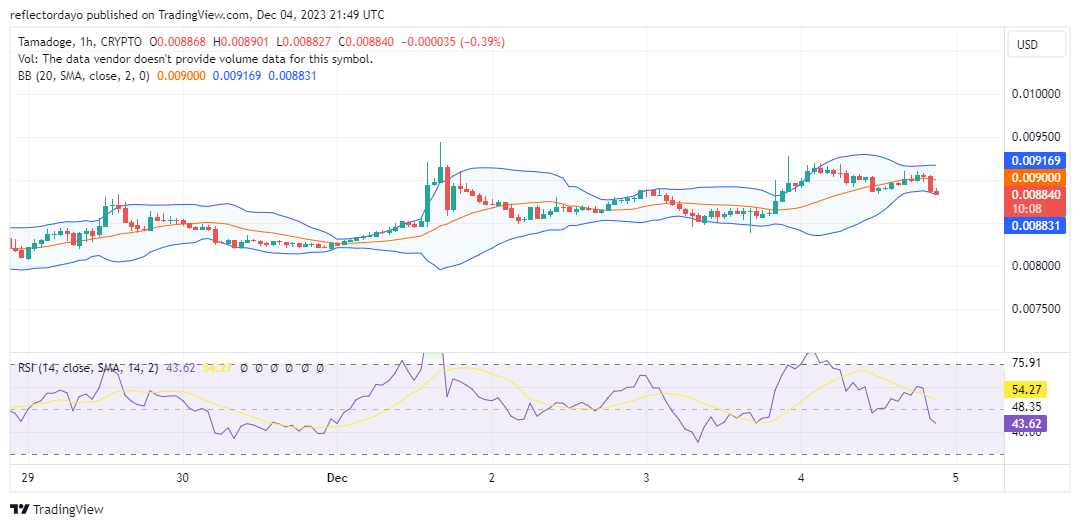
Within the price range spanning from $0.0090 to $0.0095, there is a concentration of sell orders. Several traders have maintained long market positions during the period of sideways movement around $0.008. Despite the clustering of bearish sentiment in this range, a prevailing bullish sentiment is evident, effectively containing bearish pressure at the $0.009 level. Presently, a support level is emerging around $0.008859, serving as a pivotal point to propel the market towards the $0.0095 target.
With Super Doge, unleash the potential of play-to-earn!
Unleash the power of play-to-earn with Super Doge! 🚀
Join the adventure and claim your $TAMA rewards on Tamadoge Arcade 👇
📱 Android: https://t.co/3PXpfUBjQh
📱 iOS: https://t.co/UN5MlRGOTC pic.twitter.com/uLX0i7rysT— TAMADOGE (@Tamadogecoin) December 4, 2023
Do you want a coin that will be 100 times more valuable in the next few months? That is Tamadoge. Buy TAMA today!