Polkadot (DOT/USDT) Faces Crucial Support at $3.10 as Bulls Eye Short-Term Relief Rally
Estimated Reading Time: 3 minutes
Don’t invest unless you’re prepared to lose all the money you invest. This is a high-risk investment and you are unlikely to be protected if something goes wrong. Take 2 minutes to learn more
Polkadot against Tether continues to trade under heavy bearish sentiment, sliding nearly 4% on the day timeframe and hovering around $3.18. Meanwhile, on the broader market, there has been mixed movement, but DOT remains one of the weaker altcoins, pressured by persistent selling since the early part of October.
As it stands, there appears to be a flicker of hope for buyers as the momentum indicators suggest bearish exhaustion as prices approach a critical support range around the 3.10 level.
Currently, Polkadot trades at $3.139 with more than 4.73 million in trade volume for the day.
Technical Indicators
Major Resistance Levels: $3.30, $3.45, and $3.60
Major Support Levels: $3.10, $2.95, and $2.75
Technical Analysis
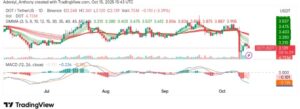
Technically, Polkadot against Tether on the daily chart appears to be in a prolonged downtrend, with prices moving below all major GMMA ribbons. This is signaling that medium- and long-term traders are still cautious. Meanwhile, the flattening MACD histogram hints that downside momentum is cooling, possibly setting the stage for a rebound attempt.
However, considering recent movement, DOT has declined sharply from $3.85 to $3.18 over the past week, confirming a clear bearish breakdown from its consolidation zone. Now, the $3.10 support serves as the key line in the sand. To this end, failure to hold above this level could invite further decline toward the $2.75 zone, while a rebound could see DOT testing its previous support-turned-resistance at $3.45.
Polkadot News Today: What’s in There?
Polkadot has been in a continuous downtrend with occasional sideways movement for a while. The token appeared to be bearish with the potential for a larger corrective move, but so far, the coin has been giving bearish signals with little possibility for an uptrend.
To this end, the $4.920 needs to be broken for a confirmed bullish move, as Polkadot charts across different timeframes remain one of the weakest in the crypto market.
DOT/USDT Analysis: Attempting Intraday Stabilization While Bulls Struggle to Regain $3.30 Zone
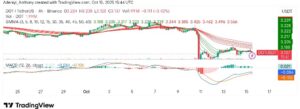
On the 4-hour timeframe, the picture supports the daily view with stabilization. After touching $3.10. Meanwhile, DOT/USDT appears to have seen a mild bounce, but the recovery is weak and still capped under the $3.30 resistance. Additionally, the MACD on 4H is attempting a bullish crossover, but the fragility of the structure suggests a lack of participation.
To this end, if DOT/USDT closes above $3.30 with increased volume in the coming session, it would signal the start of a short-term bullish correction toward $3.60. Conversely, a break below $3.10 would confirm bearish continuation, opening a slide toward $2.95 or lower.
You can purchase crypto coins here. Buy Crypto