Polkadot (DOT/USD) Poised for a Potential Breakout
Estimated Reading Time: 3 minutes
Don’t invest unless you’re prepared to lose all the money you invest. This is a high-risk investment and you are unlikely to be protected if something goes wrong. Take 2 minutes to learn more
Polkadot Long-term Analysis: Bearish
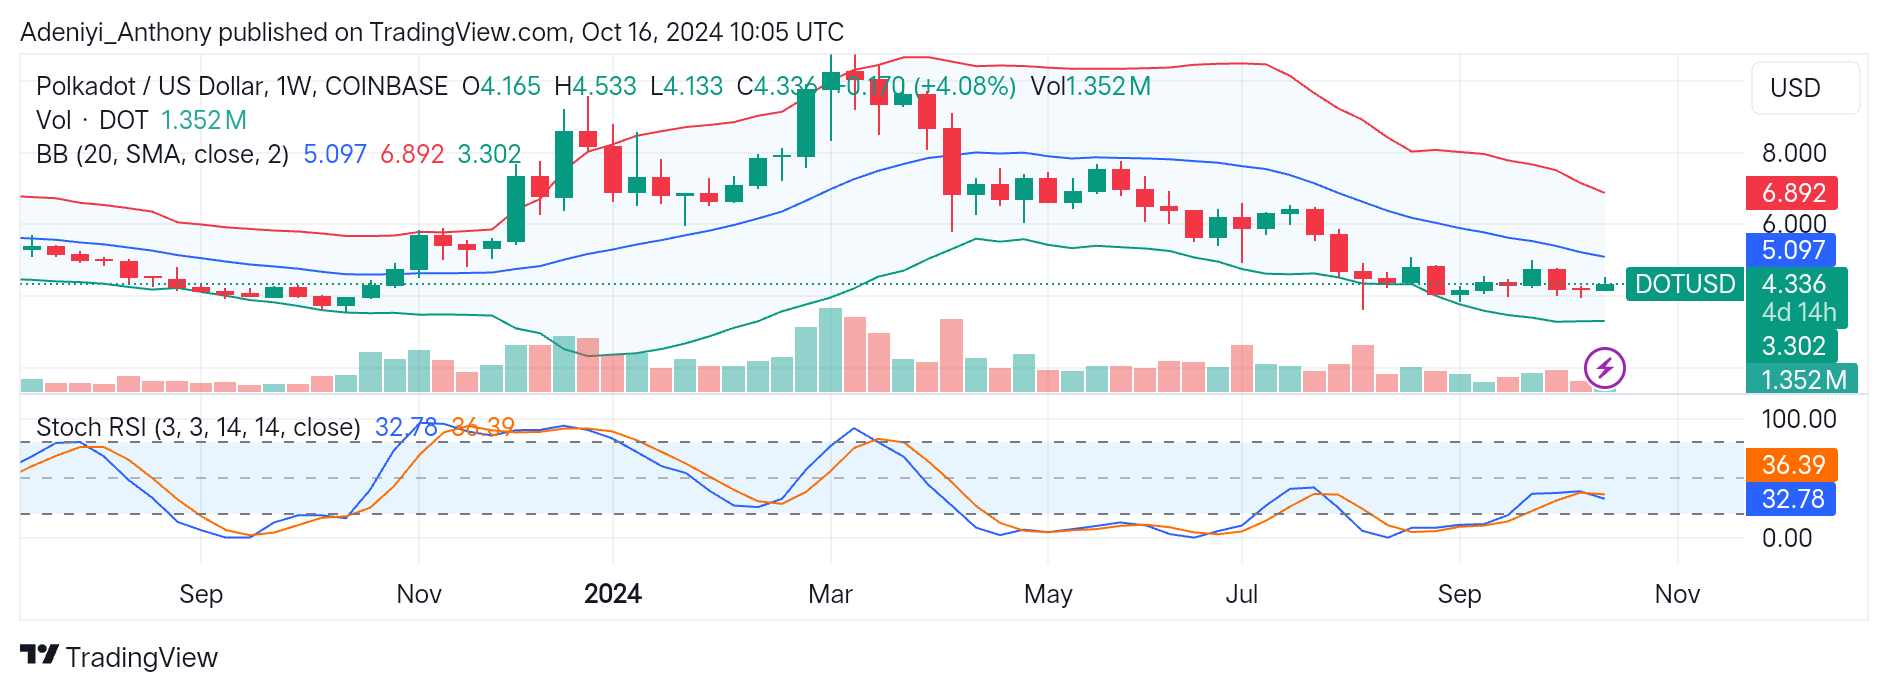
For a while, Polkadot against the U.S. dollar has been on an extended downtrend with several failed bullish attempts. However, the current tightening in volatility and the near oversold condition projected by the Stochastic oscillator suggests a reversal is near.
DOT/USD in recent moves have been cycling between the lower and the middle Bollinger bands between $5.097 and $3.302. This indicates the pair has been operating extensively in the oversold region for weeks. However, the recent short-term correction and retracement between these bands and tightening volatility suggests a potential breakout in either direction in the coming weeks. Presently, the pair trades at $4.336 with a moderate trading volume of 1.352M.
At this stance, a bullish breakout will be confirmed if the price breaks above the $5.10 level; otherwise, with the current bearish general outlook, a break below the $4.00 level will trigger further downtrends.
Technical Indicators
Major Resistance Levels: $5.097, $6.000, and $6.890
Major Support Levels: $4.130, $3.302, and $2.50
Polkadot Technical Analysis
Polkadot’s recent price action under the middle Bollinger band suggests the pair is at a crucial juncture. Currently, the pair is trading at a moderate volume of 1.352M in an oversold and low volatility condition. However, a break towards the north is possible if the price breaks above the $5.10 level.
The Stochastic RSI on the downside suspends near the oversold region, suggesting the pair is preparing to take a clear direction provided there is a spike in volume. However, a possible uptrend is possible if the lines cross above the 50-mark, but suspension or fall from this level could signal a further fall in price.
Polkadot at a Crossroad: Analysis of Potential Breakout Scenarios
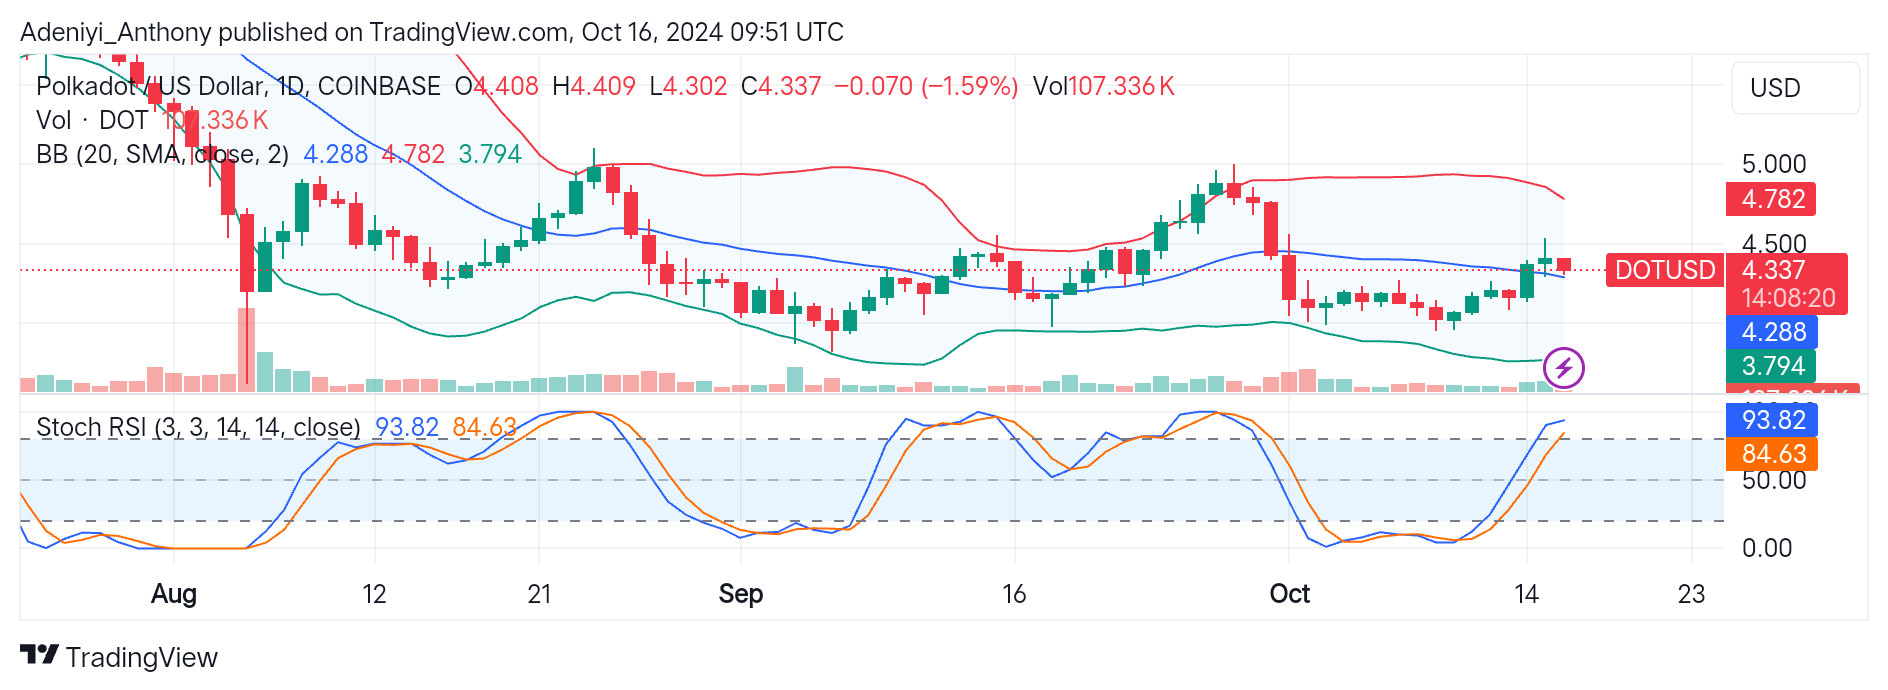
Polkadot (DOT) on the daily chart is consolidating slightly above the middle band after the formation of a spinning top, which suggests a lack of bullish strength.
In this timeframe, the pair trades at $4.337. However, the Stochastic RSI overbought condition and the squeezing of the Bollinger bands suggest a possible reversal could be the next move.
The current Polkadot setup suggests the pair is at a critical inflection point, which can lead to a bullish or bearish breakout. A bearish breakout will occur if the lines on the oscillators crossover and the price breaks below the $4.28 level. Also, traders should watch out for the $4.40 level, for a sign of a bullish breakout.
You can purchase crypto coins here. Buy LBlock