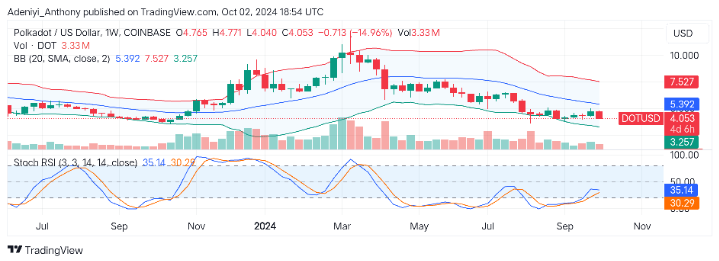
Polkadot (DOT) Operates Near Dynamic Lower Band ($3.257)
Estimated Reading Time: 2 minutes
Don’t invest unless you’re prepared to lose all the money you invest. This is a high-risk investment and you are unlikely to be protected if something goes wrong. Take 2 minutes to learn more
Polkadot (Dot) Long-term Analysis: Bearish
Currently, Dot/USD is on a downtrend to test the $3.257 dynamic support line. The pair is trending towards the south. However, if the lower band is going to act as a stronger support level depends on the activities of the investors in this timeframe.
The price movement between the $4 and $5 levels shows that there is currently a fight for market dominance between the bulls and the bears.
Presently, Polkadot is worth $4.053, a figure between the middle and the lower bands of the Bollinger Bands. Whether there is going to be a short-term correction to the top and a continuous downtrend as seen depends on the market trading volume and power of the bullish trader. The overall market condition remains bearish for now.
Technical Indicators
Major Resistance Levels: $4.771, $5.392, and $7.527
Major Support Levels: $4.040, $3.257, and $3.330
Polkadot (Dot) Indicator Analysis
The price of Polkadot has been between the lower segment of the Bollinger Band.
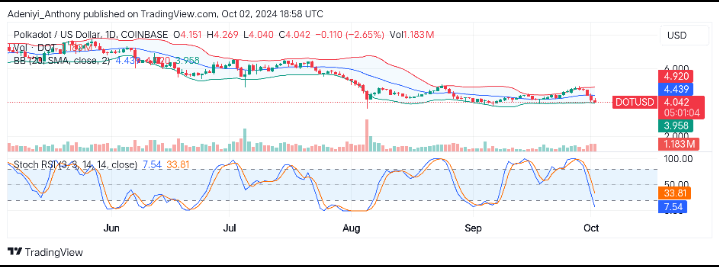
The Stochastic Relative Strength Index suggests bearish moves might end anytime soon, with the indicators in the oversold region. However, with the dynamic support level in view, the lines in the indicator might become extensively flat if a bullish trader delays their entry. In the worst case, the price might break the dynamic support line if nothing is done by the bulls.
Polkadot’s (Dot) Next Direction
On the daily chart, Dot/USD has been bearish. The pair seems to be entering the oversold region, as indicated by the Stochastic RSI. However, $3.958 has been a strong dynamic support; the price movement might resume an upward correction soon. Previous attempts to break this level were unsuccessful, but this time, the price might pierce through if bullish traders refuse to act on time.
The fate of the Altcoin hangs on the activities of the bullish traders. Otherwise, there might be a continued downtrend.
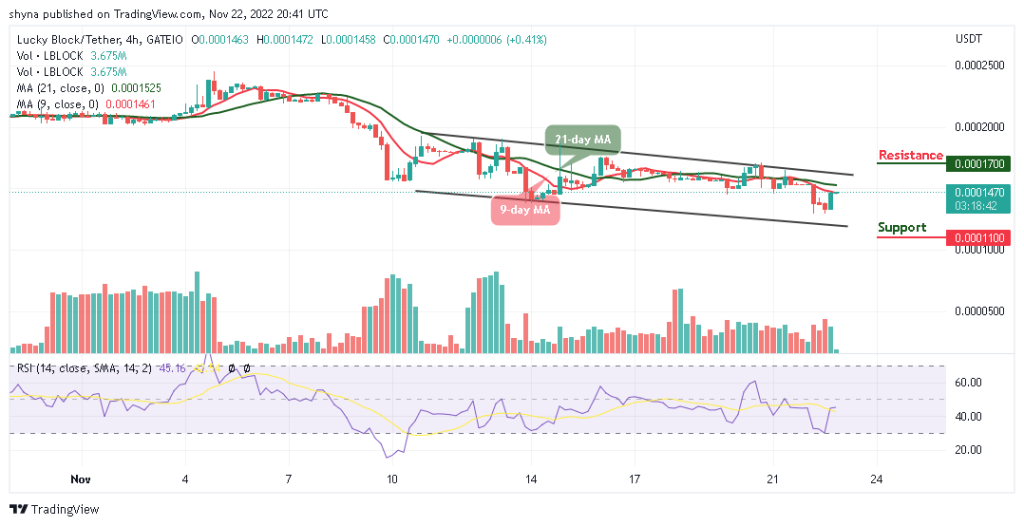
You can purchase crypto coins here. Buy LBlock