Dogecoin (DOGE) Price Prediction: DOGE/USDT Sees General Upward Rebound
Estimated Reading Time: 2 minutes
Don’t invest unless you’re prepared to lose all the money you invest. This is a high-risk investment and you are unlikely to be protected if something goes wrong. Take 2 minutes to learn more

Date: September 29, 2025
On the 24-hour chart, the Dogecoin market has rebounded upward from what seems like a higher base level. Although the market remains below key technical levels, the overall impression is still that of an upward trajectory.
DOGE/USDT Long-Term Trend — Bearish (Daily Chart)
Key Price Levels:
Resistance: $0.2500, $0.2750, $0.3000
Support: $0.2250, $0.2000, $0.1750
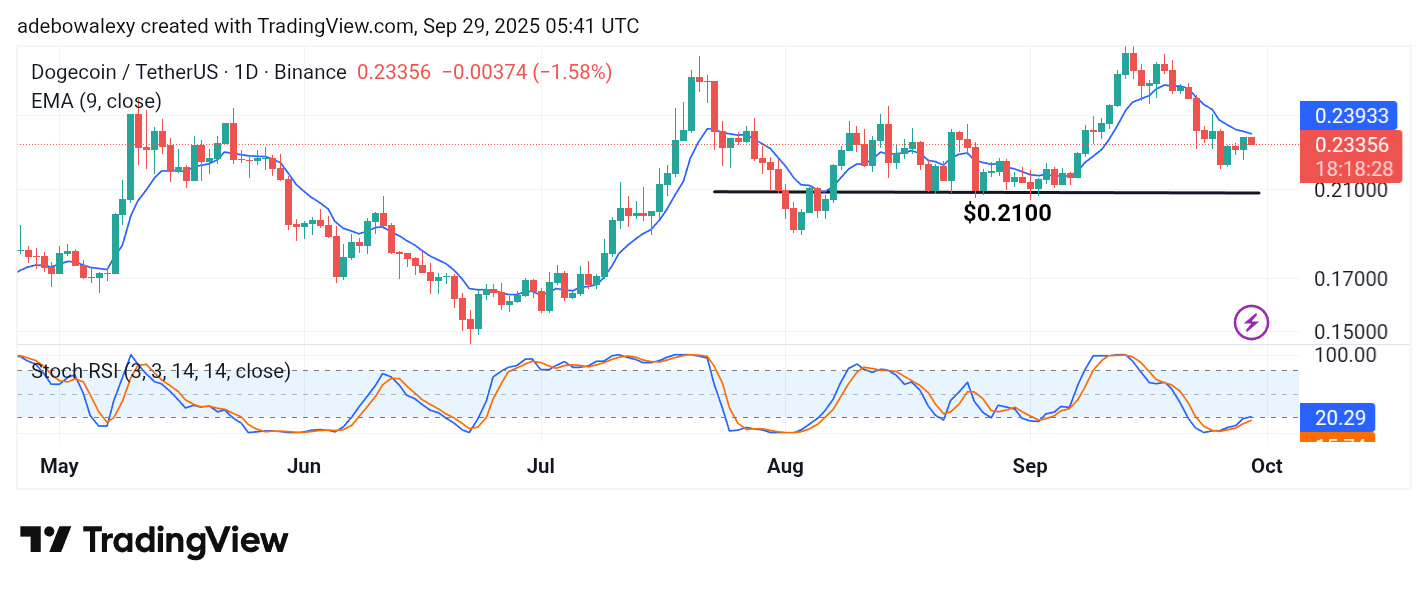
So far, the ongoing session appears bearish, as the latest price candle has turned red while standing near the 9-day Exponential Moving Average (EMA) line. The Stochastic Relative Strength Index (SRSI) line generally trends upward; however, a modest downward deflection in the current session has slightly bent the lead line of the SRSI.
Dogecoin (DOGE) Price Prediction: DOGE/USDT Bears Attempt to Reclaim Dominance
From the Dogecoin’s daily chart, price action shows that bulls have made some short-term progress. However, the ongoing session has weakened the broader upward outlook.
The SRSI line is still rising from the oversold region with an overall upward trajectory. Meanwhile, the lead line of the indicator is starting to turn slightly sideways around the 20 mark. This suggests that traders may want to wait for a decisive crossing of price action above the 9-day EMA line before taking a stronger bullish stance.
Dogecoin (DOGE) Price Prediction: DOGE/USDT Bears Advance Toward a Key Level (4-Hour Chart)
On the 4-hour chart, Dogecoin has recorded two consecutive bearish sessions. However, the decline remains modest, as reflected by the corresponding price candles, with the market still trading above the 9-day EMA curve.
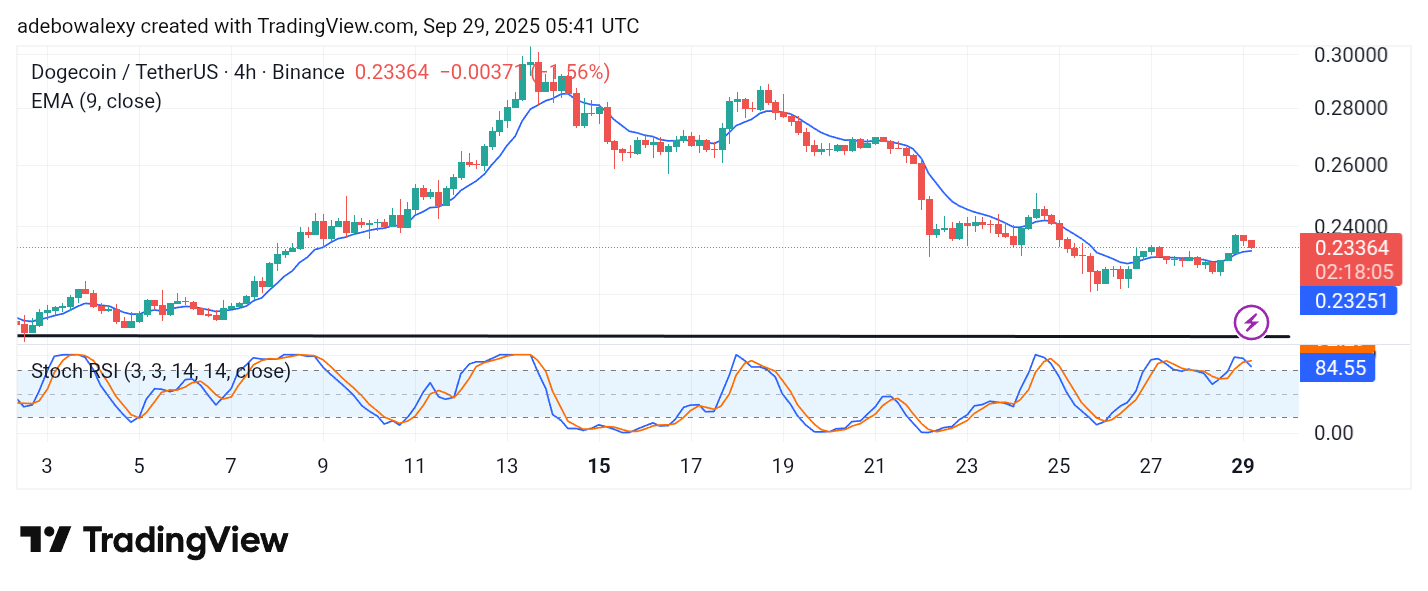
At the same time, the SRSI indicator lines are descending toward the 80 mark after a downward crossover in the overbought region. This indicates that traders may prefer to stay on the sidelines for now, waiting to see if an upward rebound occurs off the 9-day EMA curve, potentially pushing price action back toward the $0.2500 level.