Dogecoin (DOGE) Price Prediction: DOGE/USDT Descends Toward the $0.1300 Price Level
Estimated Reading Time: 2 minutes
Don’t invest unless you’re prepared to lose all the money you invest. This is a high-risk investment and you are unlikely to be protected if something goes wrong. Take 2 minutes to learn more

Dogecoin (DOGE) Price Prediction (April 7, 2025)
As Bitcoin continues to dip, the broader crypto market is also feeling the pressure, with other altcoins being dragged into the same downtrend. Price action in this market continues to suggest a further decline from a technical indicators’ point of view.
DOGE/USDT Long-Term Trend: Bearish (Daily Chart)
Key Price Levels:
Resistance: $0.1500, $0.1750, $0.2000
Support: $0.1300, $0.1150, $0.1000
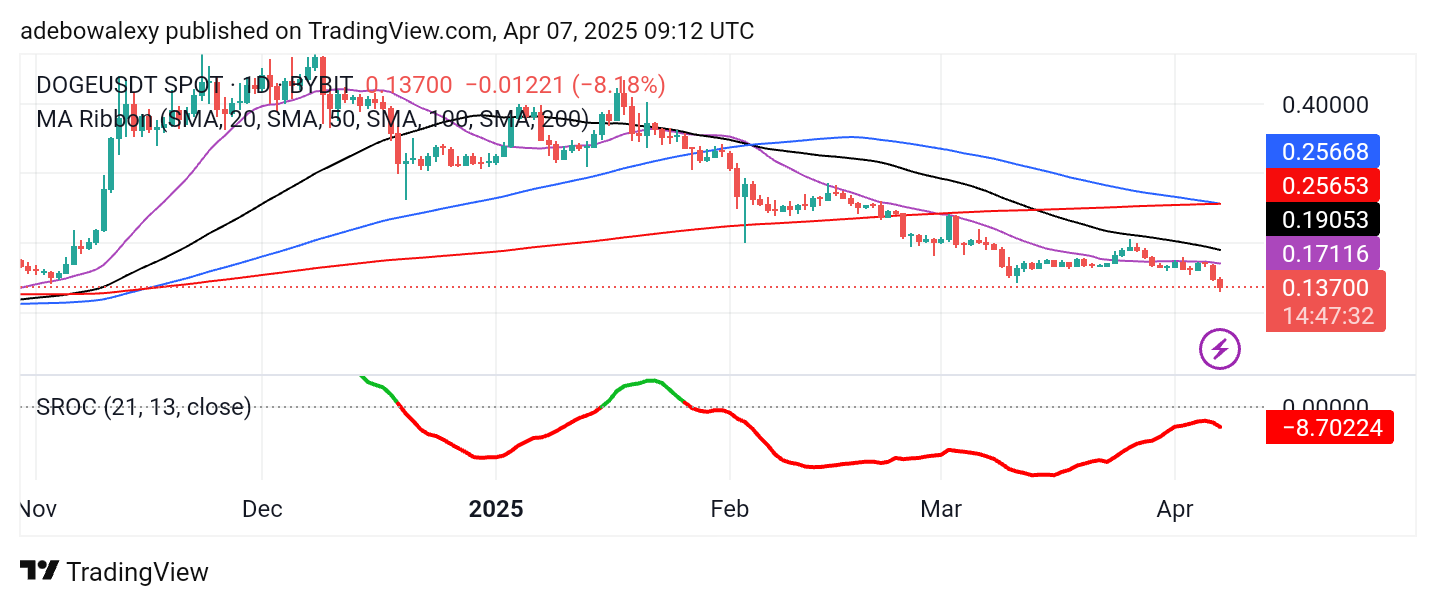
Over the past two sessions, price action has been trending lower. The current session appears as a red-price candle, pushing the market below all visible Moving Average (MA) lines. The 100-day and 200-day MA lines are converging for a crossover above the price action, indicating a strengthening bearish sentiment. Additionally, the Stochastic Rate of Change (ROC) lines are positioned below the 0.00 level and are taking a downward trajectory, further below the equilibrium level.
Dogecoin (DOGE) Price Prediction: DOGE/USDT Bears Remain Solidly in Control
Observing the Dogecoin market on the daily chart, it appears poised for further bearish momentum. This can be deduced from the formation and position of the most recent price candle.
Furthermore, the convergence of the 100-day and 200-day MA lines supports the view of mounting bearish pressure. The Stochastic ROC indicator lines are also below the equilibrium level, and their continued downward trajectory suggests that this market remains vulnerable to further price declines.
Dogecoin (DOGE) Price Prediction: DOGE/USDT Sees a Moderate Upward Rebound, Yet Stays Vulnerable (4-Hour Chart)
The 4-hour chart of the Dogecoin market shows a moderate rebound. However, price action remains below all the MA lines on the chart.
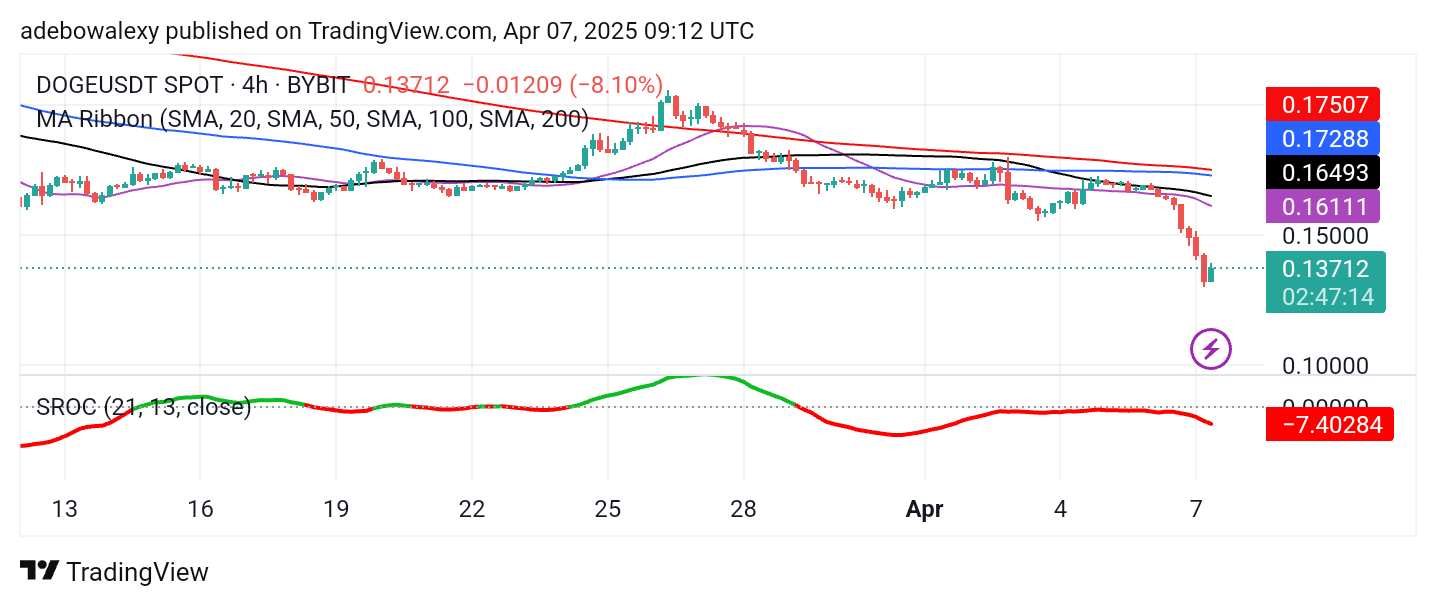
Similar to the daily chart, the Stochastic ROC indicator lines remain below the equilibrium level and maintain a downward trajectory, with the indicator currently reading -7.40. Based on these signals, it appears likely that the price will continue to decline. Therefore, traders should brace for a potential impact around the $0.1300 price level.