Cardano (ADA) Retraces From $2.10 High, Uptrend Likely
Estimated Reading Time: 2 minutes
Don’t invest unless you’re prepared to lose all the money you invest. This is a high-risk investment and you are unlikely to be protected if something goes wrong. Take 2 minutes to learn more

Cardano (ADA) Long-Term Analysis: Bullish
Today, Cardano’s (ADA) price continues its bullish run as it reaches the high of $2.07. The altcoin was repelled at the $2.10 resistance zone. The selling pressure is likely to resume as the market reaches overbought conditions for several days. Today, the altcoin is falling from the recent high. The retracement is likely to reach the low of $1.78. However, the bulls are attempting to push price to the $2.10 resistance zone. On the upside, if the bulls break above the $2.10 resistance, the market will rise to level $2.40.
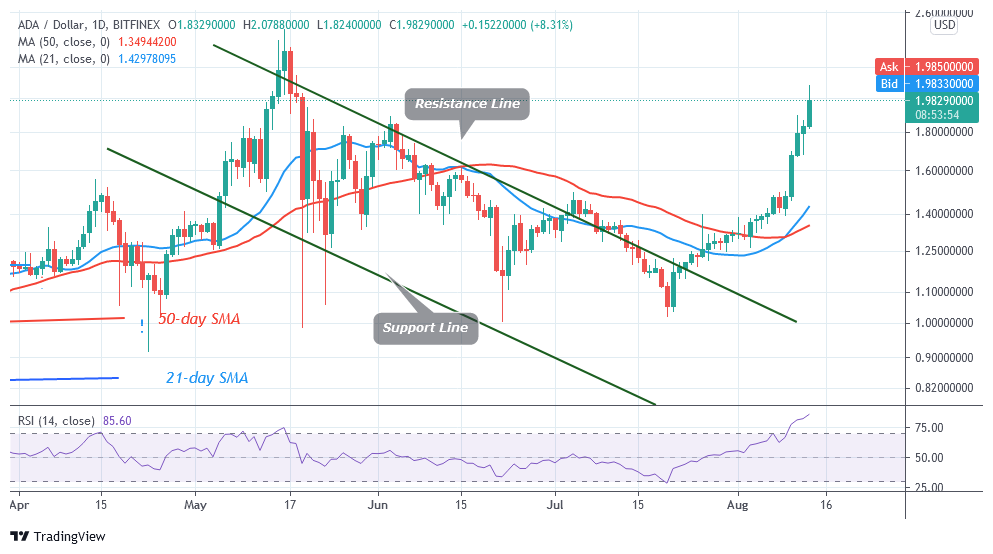
Cardano (ADA) Indicator Analysis
Cardano is at level 85 of the Relative Strength Index period 14. The market is seriously overbought at level 85. Sellers are likely to emerge. ADA has a bullish crossover. The 21-day SMA crosses over the 50-day SMA indicating a buy signal. The crypto is above the 80% range of the daily stochastic. Cardano has been overbought since August 9. Sellers are likely to emerge as buyers face rejection at the $2.10 high.
Technical indicators:
Major supply zones: $2.0, $2.20, $2.40
Major demand zones: $1.40, $1.20, $1.00
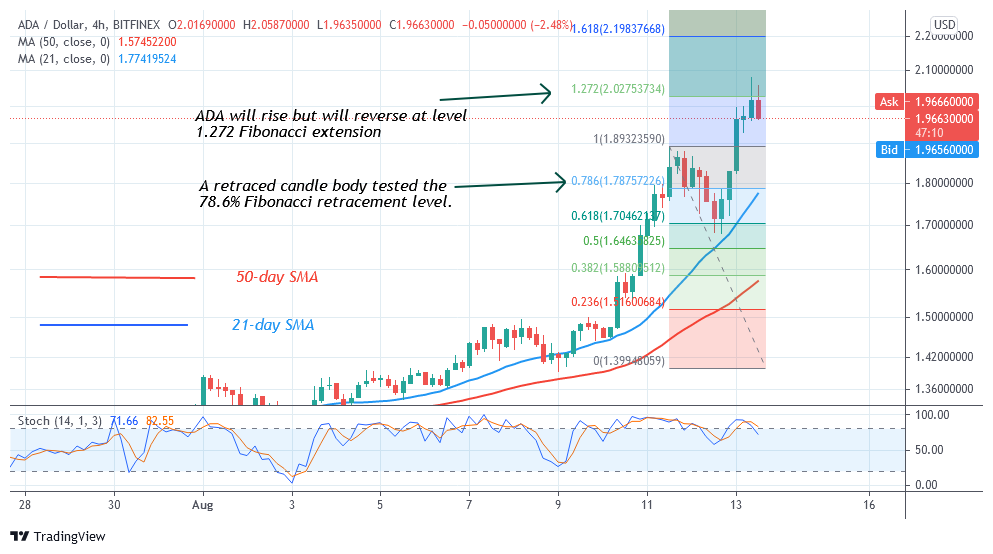
What Is the Next Direction for Cardano (ADA)?
Cardano’s price has been in an upward move. On the 4-hour chart, the bulls broke the resistance at $1.90 but were repelled at the $2.08 high. Meanwhile, on August 11 uptrend; a retraced candle body tested the 78.6% Fibonacci retracement level. The retracement indicates that ADA is likely to rise but reverse at level 1.272 Fibonacci extension or level $2.02. From the price action, ADA has retested 1.272 Fibonacci extension and reversed.
You can purchase crypto coins here. Buy Token
Note: Cryptosignals.org is not a financial advisor. Do your research before investing your funds in any financial asset or presented product or event. We are not responsible for your investing results