Binance Coin in a Range-Bound Move, Faces Rejection at $520
Estimated Reading Time: 2 minutes
Don’t invest unless you’re prepared to lose all the money you invest. This is a high-risk investment and you are unlikely to be protected if something goes wrong. Take 2 minutes to learn more
Binance Coin (BNB) Long-Term Analysis: Bullish
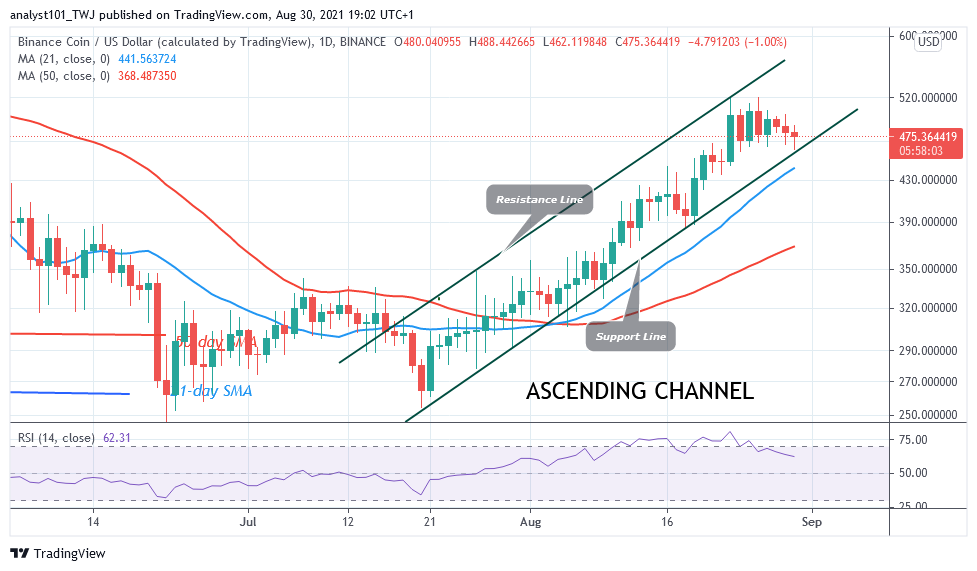
Binance Coin’s (BNB) price has retraced to the low of $462 after rejection from the high of $520. The selling pressure appears to have subsided as the candlestick shows long tails pointing downward. The candlestick long tails are describing that there is strong buying pressure above the current support level. On the lower time frame, BNB plunged to $463 low but pulled back above $471. This was as a result of strong buying pressure above the current support. Presently, crypto is fluctuating between the $460 and $520 price levels. The uptrend will resume if price breaks above the $520 resistance.
Binance Coin (BNB) Indicator Analysis
Binance Coin is at level 61 of the Relative Strength Index period 14. It indicates that the coin is in the bullish trend zone and above the centerline 50. The crypto is above the 25% range of the daily stochastic. It indicates that the market is in a bullish momentum
Technical indicators:
Major ResistancIs ie Levels – $640, $660, $680
Major Support Levels – $540, $520, $500
What Is the Next Direction for Binance Coin (BNB)?
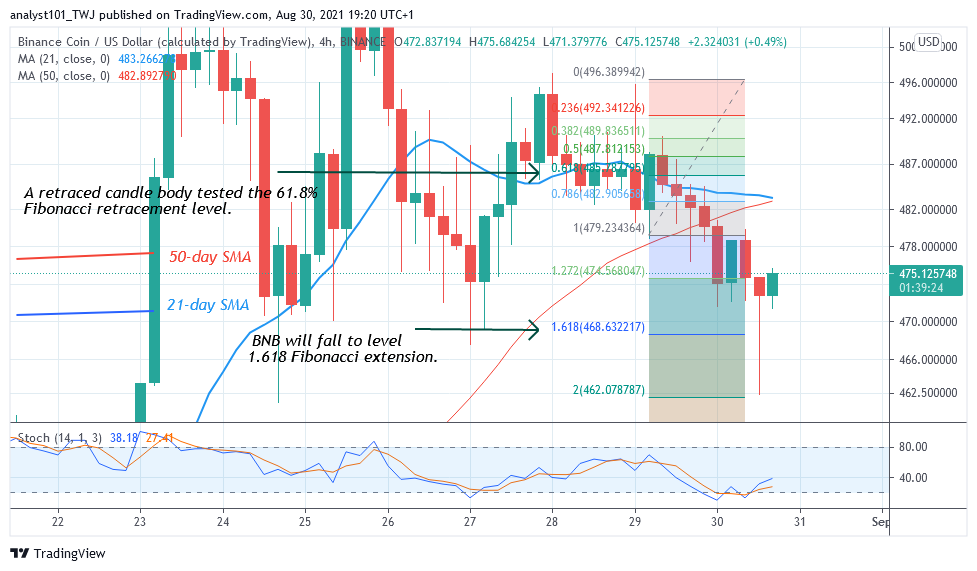
On the 4 –hour chart, the altcoin has been in a downward move. The price indicator has shown that the altcoin has reached bearish exhaustion. Meanwhile, on August 29 downtrend; a retraced candle body tested the 61.8% Fibonacci retracement level. The retracement indicates that the coin will fall to level 1.618 Fibonacci extension or level $468. 63. From the price action, the BNB price tested the 1.618 Fibonacci extensions and resumed upward.
You can purchase crypto coins here. Buy Tokens
Note: Cryptosignals.org is not a financial advisor. Do your research before investing your funds in any financial asset or presented product or event. We are not responsible for your investing results