Bitcoin (BTC/USD) Market Dumps Rapidly, Settling New Supports
Estimated Reading Time: 3 minutes
Don’t invest unless you’re prepared to lose all the money you invest. This is a high-risk investment and you are unlikely to be protected if something goes wrong. Take 2 minutes to learn more

Free Crypto Signals Channel
Bitcoin Price Prediction – May 15
It has first time observed that the BTC/USD market dumps rapidly, settling new supports at lower-trading spots currently as indicated in this analytics write-up. Presently, the high and low trading value lines are seen at $30,304 and $29,527 as the trade maintains a minute negative percentage of 0.51.
BTC/USD Market
Key Levels
Resistance levels: $32,500, $35,000, $37,500
Support levels: $27,500, $25,000, $22,500
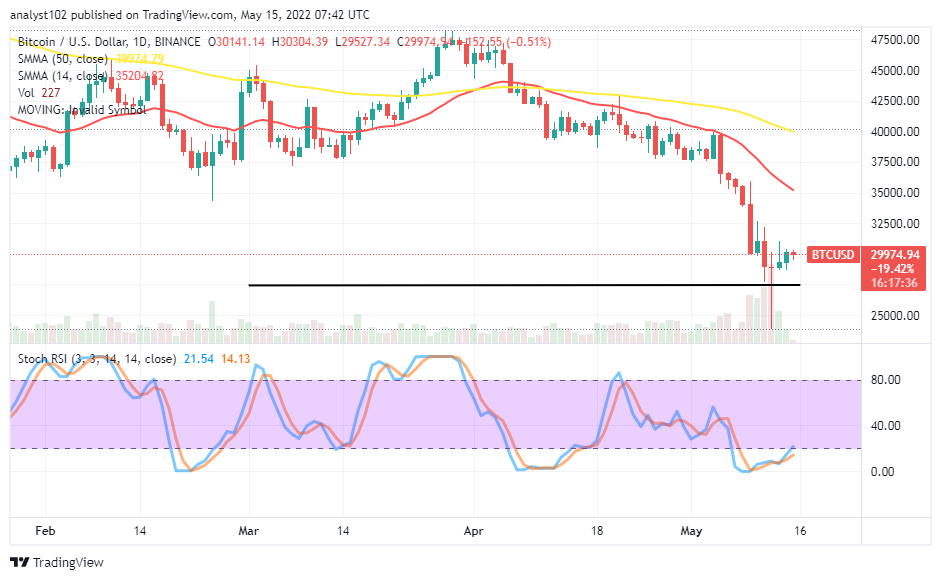
BTC/USD – Daily Chart
The BTC/USD daily chart showcases the crypto-economic market dumps rapidly, settling new supports at fresh lower-trading spots. The 14-day SMA indicator is underneath the 50-day SMA indicator. The horizontal line drawn at the $27,500 shows the near support-trading area that the price needs to keep swinging upward further in its recuperation moving efforts. The Stochastic Oscillators are in the oversold region, moving in a consolidation manner. And they are attempting to point northbound against the range 20 from within.
Will there be more crashes in the BTC/USD market operations soon?
The can be more crashes in the BTC/USD market operations if the bulls’ capacity of making a come-back doesn’t pump up in a bid to break past the $32,500 resistance. It would still be a technical trading approach that long-position takers be alert to spot when strong reversal motion will be against active downing motions around those support trading levels as before considering launching a buying order afterward.
On the downside of the technical analysis, the BTC/USD market short-position placers may have to wait for rejections of price actions between the $32,500 and the $35,000 resistance levels to observe a genuine selling order potentially. In negation to that sentiment, a long-holding of the market trading positions around the $30,000 could summarily let in bearish motions in the long-term run.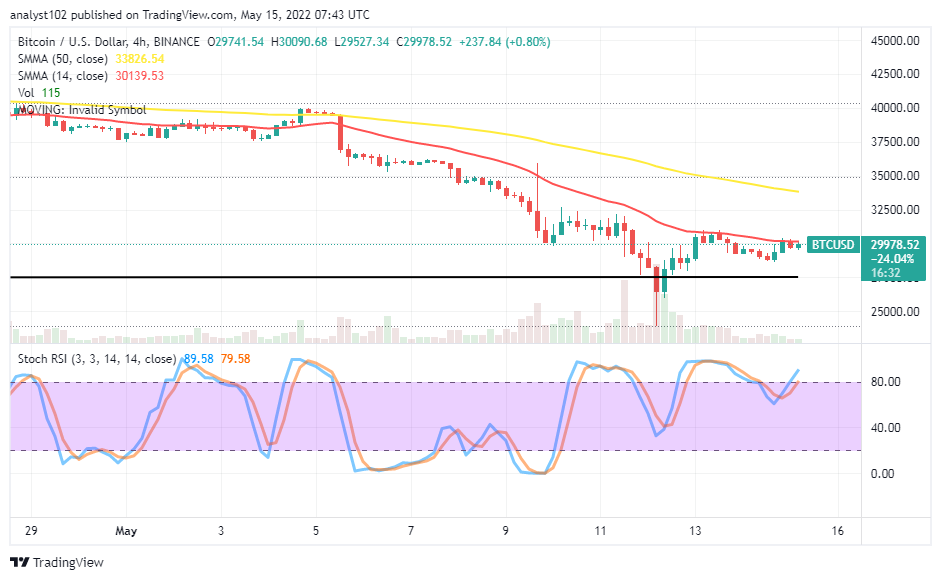
BTC/USD 4-hour Chart
The BTC/USD medium-term chart shows the crypto-economic market dumps rapidly, settling new supports at a dipper-shallow trading spot below the SMAs. The 14-day SMA trading indicator is underneath the 50-day SMA trading indicator. The Stochastic Oscillators are around the 80 range, moving in a consolidation style to denote the crypto economy is under a striving mood to push against the US fiat purchasing power presently away around the $30,000 trading level.
Note: Cryptosignals.org is not a financial advisor. Do your research before investing your funds in any financial asset or presented product or event. We are not responsible for your investing results.
You can purchase Lucky Block here. Buy LBlock: