POL (ex-MATIC) Price Prediction: POL/USDT Buyers Remain Complacent
Estimated Reading Time: 2 minutes
Don’t invest unless you’re prepared to lose all the money you invest. This is a high-risk investment and you are unlikely to be protected if something goes wrong. Take 2 minutes to learn more

POL (ex-MATIC) Price Prediction (April 4, 2025)
Since the POL (ex-MATIC) market dropped below the $0.2000 level, price activity has remained beneath this threshold. Although there have been recent traces of an upward retracement, price movement still appears generally restrained.
POL/USDT Long-Term Trend: Bearish (Daily Chart)
Key Price Levels:
Resistance: $0.2000, $0.2250, $0.2500
Support: $0.1800, $0.1600, $0.1400
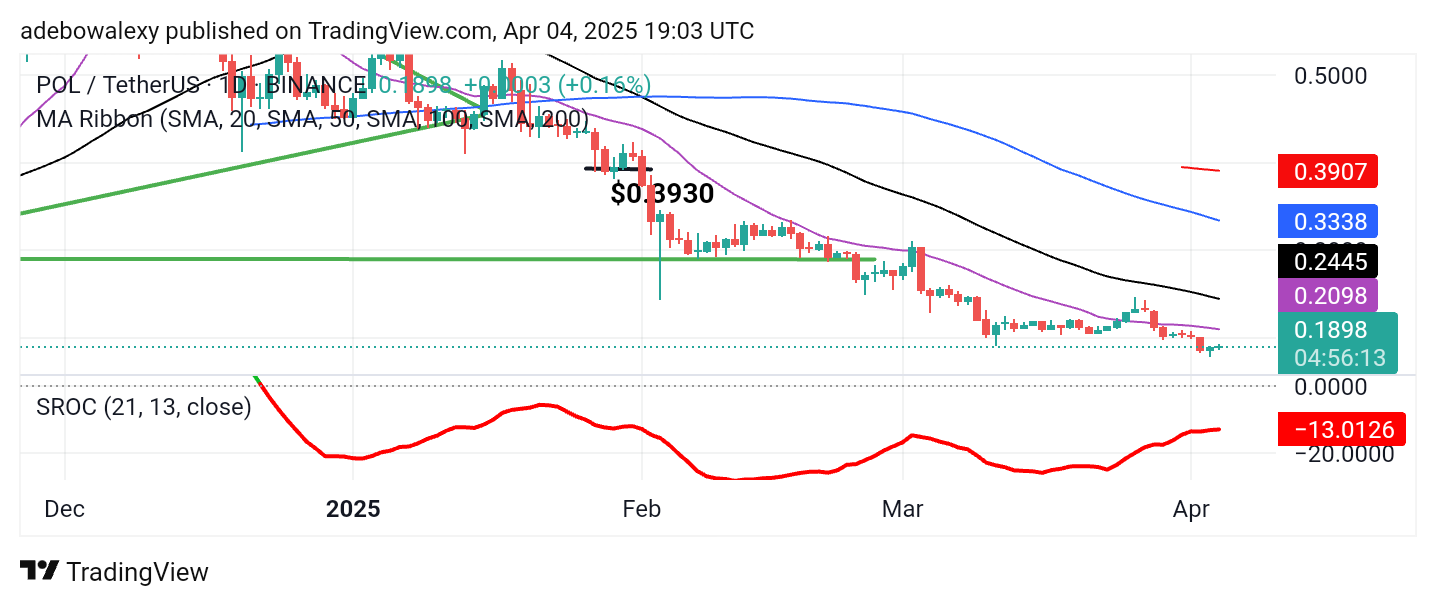
The POL (ex-MATIC) market has remained confined below the $0.2000 level, as mentioned earlier. However, both the current and previous sessions have shown some minimal upward retracement, as indicated by the formation of green candles. Despite this, price action remains below all the Moving Average (MA) lines. The Stochastic Rate of Change (Stochastic ROC) indicator lines remain below the equilibrium level of 0.00, with only a slight upward slope.
POL (ex-MATIC) Price Prediction: POL/USDT Isn’t Ready to Break Free
An examination of the daily chart for POL (ex-MATIC) shows that bullish momentum is still insufficient. This continues to limit bullish sentiment in the market. Even the minimal upward retracement seems to be losing steam, as the latest price candle appears smaller than the previous one.
Additionally, price action remains below all MA lines, and the Stochastic ROC indicator is trending nearly sideways. This suggests that bullish momentum is not gaining the necessary support.
POL (ex-MATIC) Price Prediction: POL/USDT Remains Consistent with Lackluster Performance (4-Hour Chart)
Price action in the POL (ex-MATIC) market continues to reflect a mediocre performance below the $0.2000 mark, even on the 4-hour chart. Price movement is characterized by minor gains, with candles remaining small—signaling weakening bullish momentum.
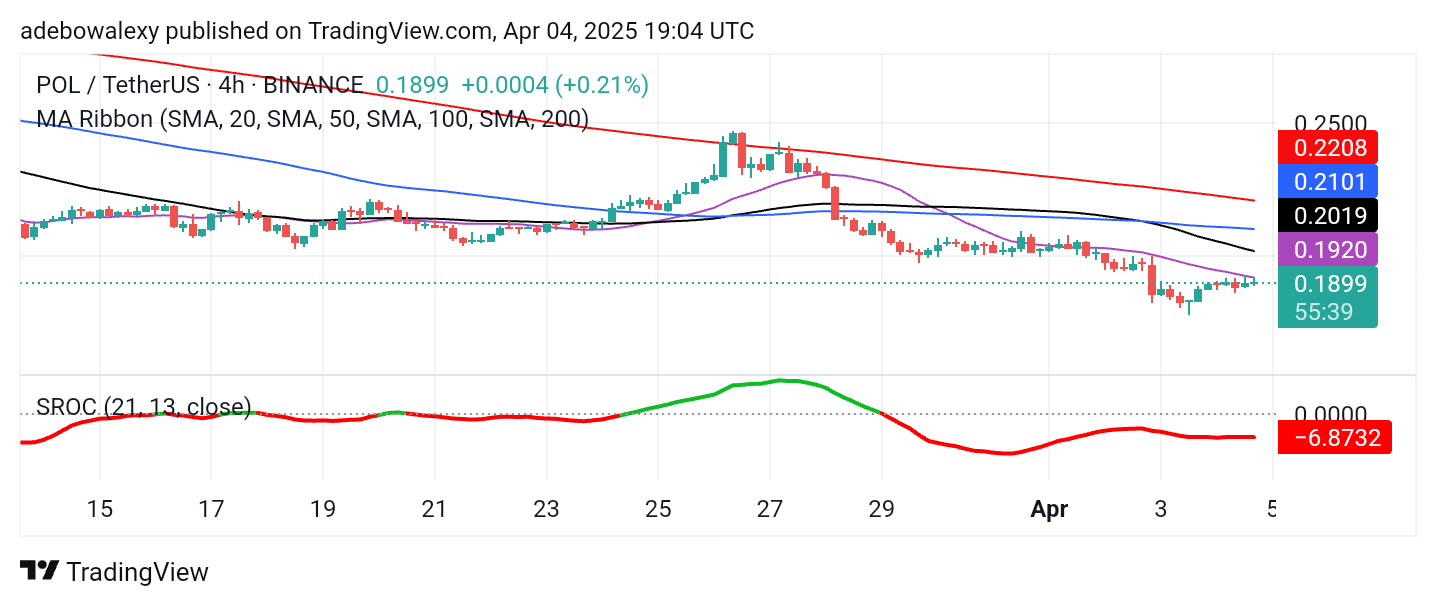
The latest candle, while testing the 20-day MA line, remains below all MA curves. The Stochastic ROC indicator line is moving completely sideways, indicating a lack of strengthening bullish momentum. As a result, bullish expectations should remain subdued, with prices likely to stay below the $0.2000 level in the near term.