Polkadot Holds above $16 as Bulls Battle to Break Resistance at $19
Estimated Reading Time: 2 minutes
Don’t invest unless you’re prepared to lose all the money you invest. This is a high-risk investment and you are unlikely to be protected if something goes wrong. Take 2 minutes to learn more

Free Crypto Signals Channel

Polkadot (DOT) Long-Term Analysis: Bearish
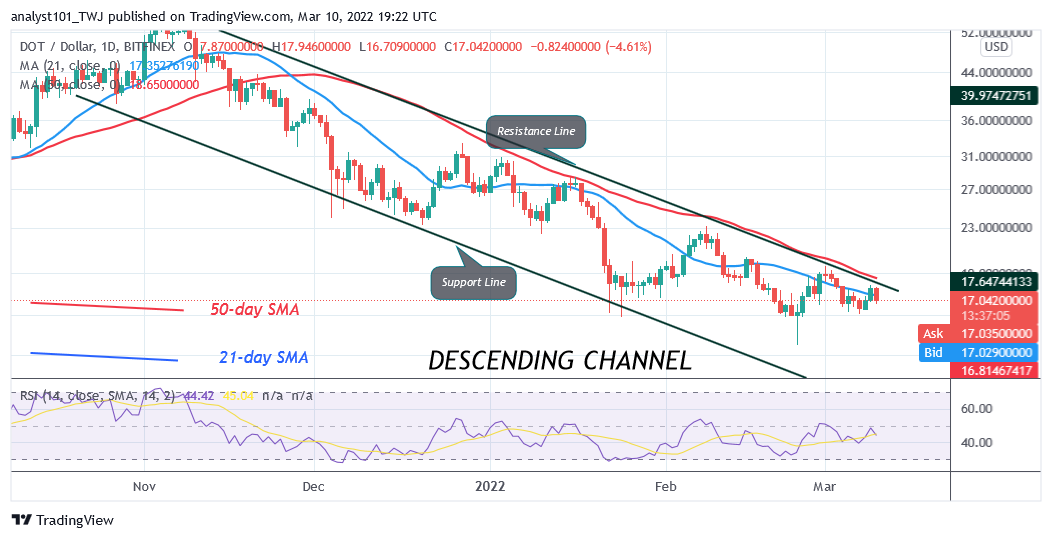
Polkadot’s (DOT) price has continued its downward correction as bulls battle to break resistance at $19. Yesterday, the bulls break above the 21-day line SMA but failed to sustain the bullish momentum. Today, the DOT price has fallen below the moving averages as the altcoin revisits the previous low at $16. On the downside, if the bears break below the $16 support, the market will decline to $11. On the upside, DOT will continue to fluctuate between $16 and $22 price levels if the current support holds,.
Polkadot (DOT) Indicator Analysis
The crypto’s price is below the 50-day line SMA and the 21-day line SMA indicating a possible fall. DOT price is at level 44 of the Relative Strength Index period 14. It is in the downtrend zone and below the centerline 50. DOT/USD price is below the 50% range of the daily stochastic. The market is in a bearish momentum.
Technical indicators:
Major Resistance Levels – $48, $52, $56
Major Support Levels – $32, $28, $24
What Is the Next Direction for Polkadot (DOT)?
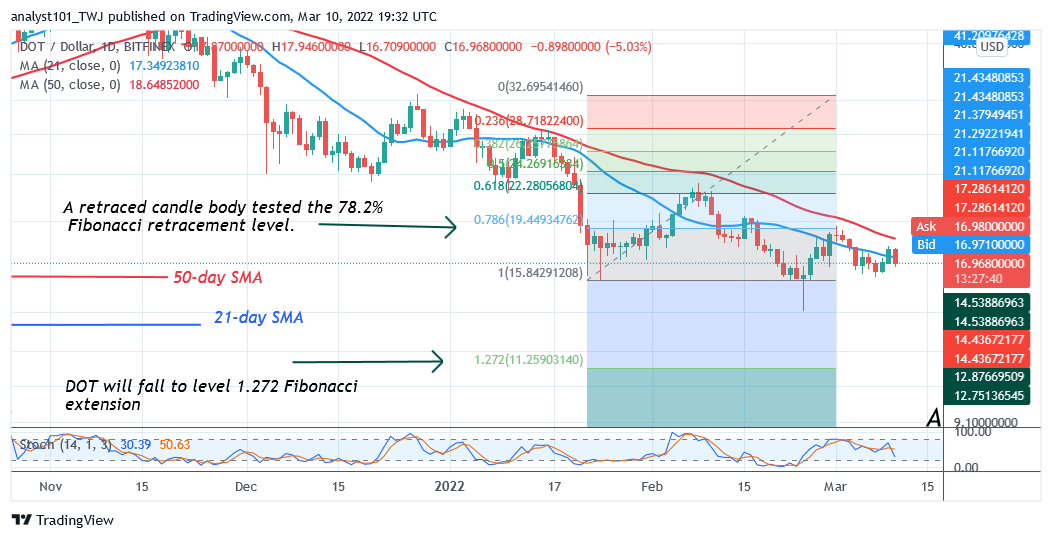
DOT/USD is in a downward move as bulls battle to break resistance at $19. However, the selling pressure has eased after the January 22 price slump. On January 22 price slump, Polkadot fell to $16 low and commenced a range-bound move. Meanwhile, on January 22 downtrend; a retraced candle body tested the 78.6% Fibonacci retracement level. The retracement suggests that DOT price will fall to level 1.272 Fibonacci extension or level $11.17. From the price action, the DOT price has reversed above the $16 support.
.
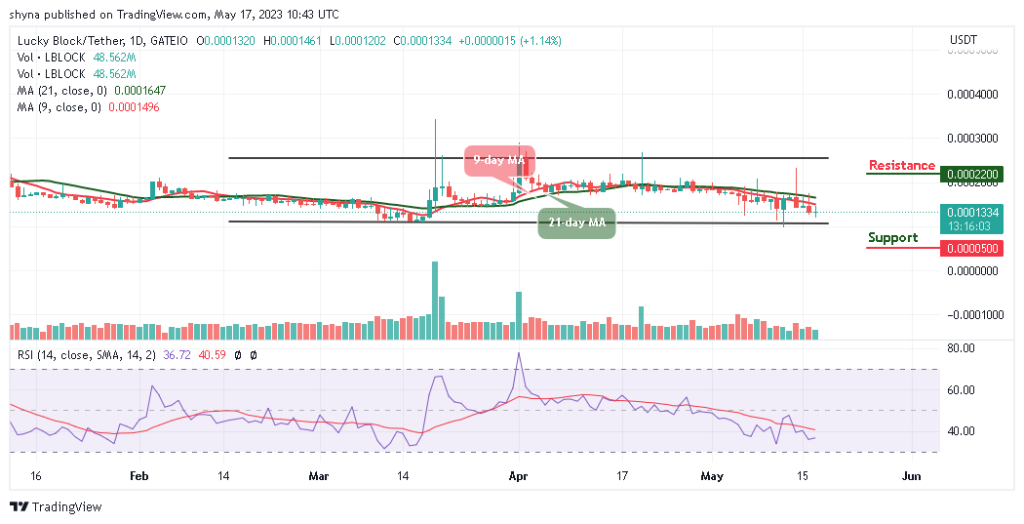
You can purchase crypto coins here. Buy LBlock
Note: Cryptosignals.org is not a 1a financial advisor. Do your research before investing your funds in any financial asset or presented product or event. We are not responsible for your investing results