Polkadot Holds above $15 Support, Risks Further Decline to $10 Low
Estimated Reading Time: 2 minutes
Don’t invest unless you’re prepared to lose all the money you invest. This is a high-risk investment and you are unlikely to be protected if something goes wrong. Take 2 minutes to learn more

Free Crypto Signals Channel

Polkadot (DOT) Long-Term Analysis: Bearish
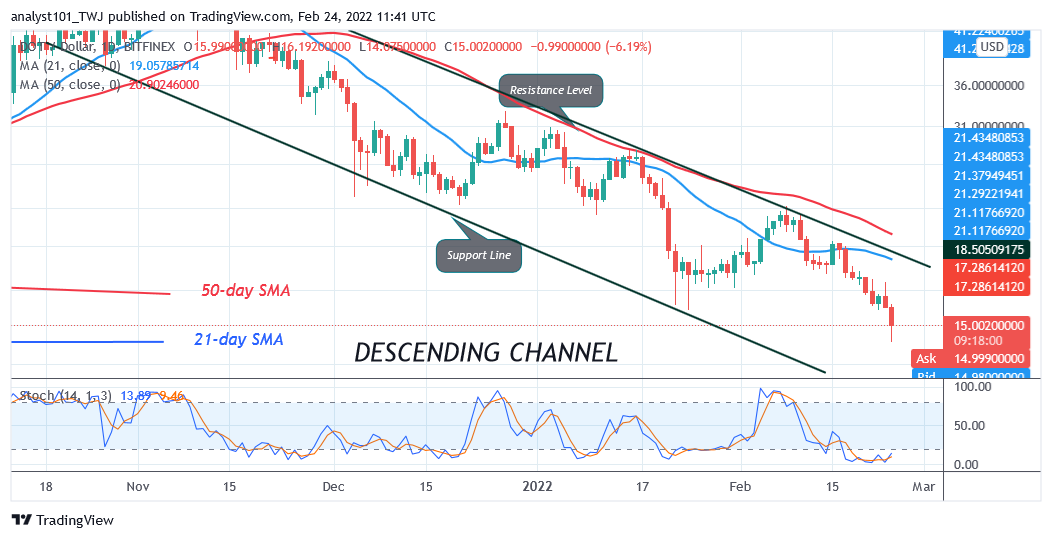
Polkadot’s (DOT) price is in a downward correction as it risks further decline to $10 Low. The bears broke the previous low of the January 22 price slump and reached the low of $14.07 but the bulls bought the dips. Today, the DOT price pulled back to above $15.13 which is the historical price level of June 2021. On the downside, if the bears break below the $15 support, the DOT price will decline to the low of $10. On July 10, 2021, the bears broke below the $15 support and decline to $10 low.
Polkadot (DOT) Indicator Analysis
The crypto’s price is below the 21-day line and the 50-day line moving averages. Normally, a further downward movement is expected as altcoin trades in the bearish trend zone. A further downward move is unlikely as the market reaches an oversold region. DOT/USD price is below the 20% range of the daily stochastic. The market has fallen to the oversold region.
Technical indicators:
Major Resistance Levels – $48, $52, $56
Major Support Levels – $32, $28, $24
What Is the Next Direction for Polkadot (DOT)?
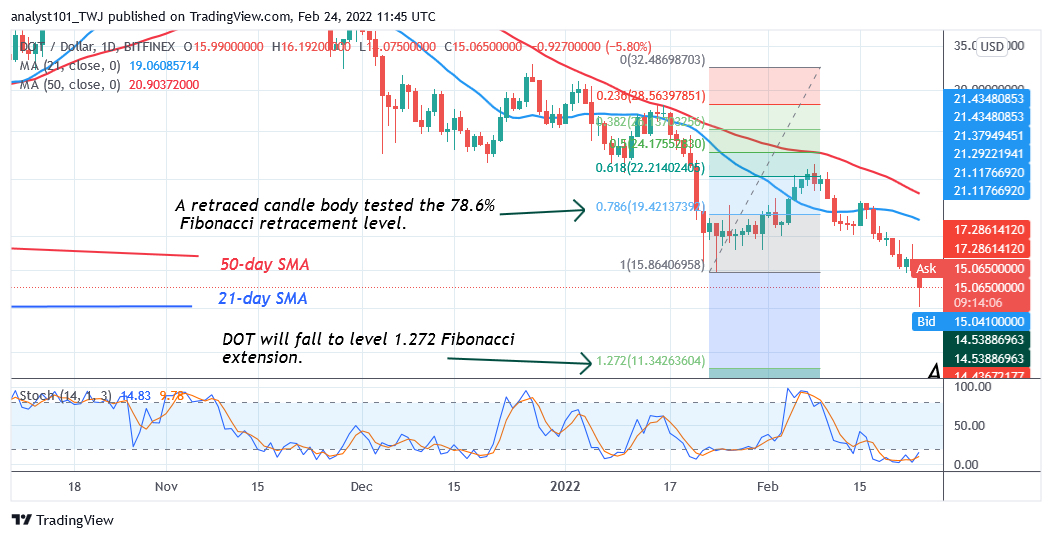
DOT/USD hovers above $15 support as it risks further decline to $10 Low. Meanwhile, on January 22 downtrend; a retraced candle body tested the 78.6% Fibonacci retracement level. The retracement suggests that DOT will fall to level 1.272 Fibonacci extension or level $11.34. From the price action, DOTprice fell to the low of $14.07 and pulled back.
.
You can purchase crypto coins here. Buy LBlock
Note: Cryptosignals.org is not a 1a financial advisor. Do your research before investing your funds in any financial asset or presented product or event. We are not responsible for your investing result