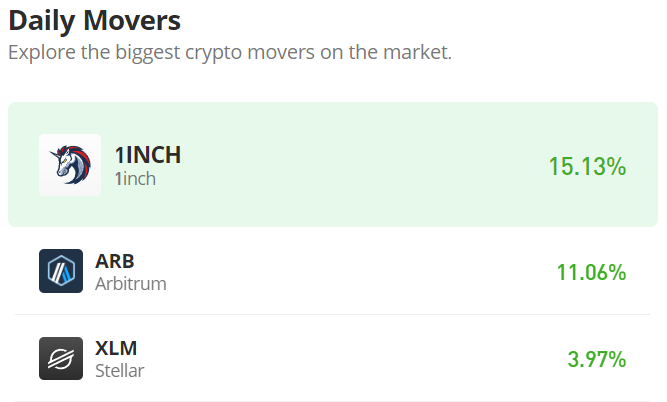
Uniswap (UNI) Price Prediction: UNI/USDT Bulls Appear Overwhelmed
Estimated Reading Time: 2 minutes
Don’t invest unless you’re prepared to lose all the money you invest. This is a high-risk investment and you are unlikely to be protected if something goes wrong. Take 2 minutes to learn more

Date: January 1, 2026
The Uniswap market has faced strong headwinds in recent sessions, causing price action to drop sharply below key technical levels. Although the ongoing session appears relatively stable and bearish momentum has slowed, the market still looks poised for further downside.
UNI/USDT Long-Term Trend — Bearish (Daily Chart)
Key Price Levels
Resistance: $6.00, $7.00, $8.00
Support: $5.50, $5.00, $4.50
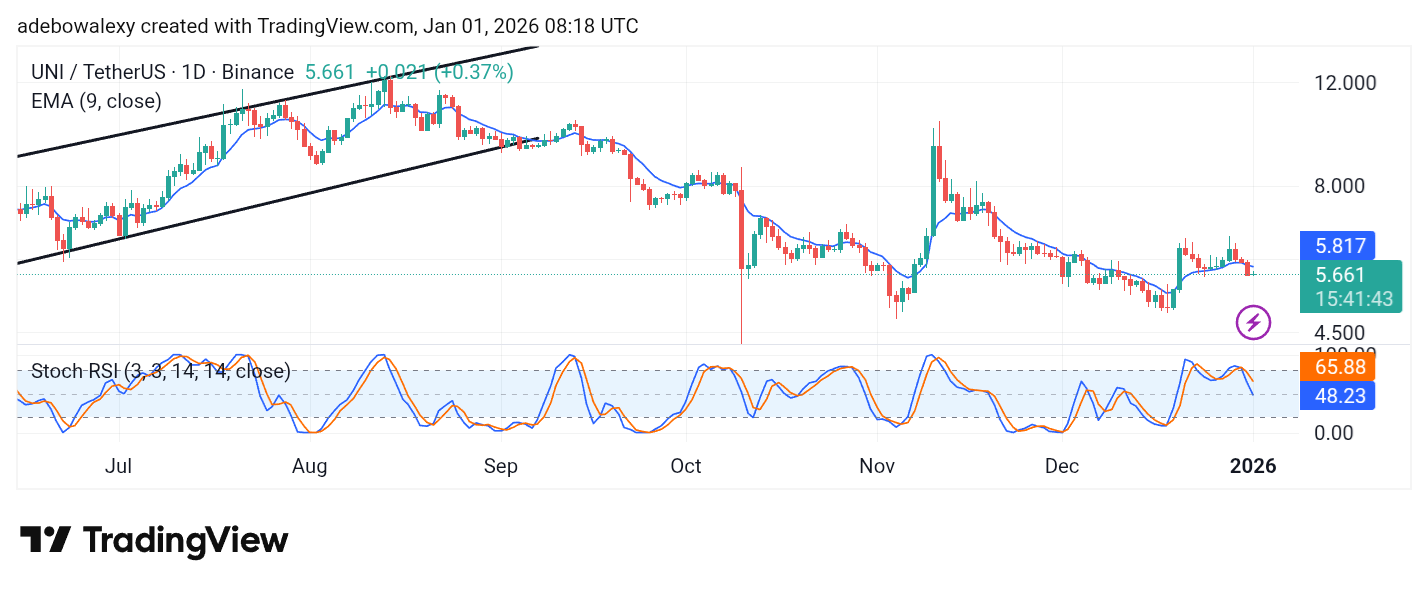
Over the past three sessions, price action has followed a much steeper downward path. The most recent price candle is green but remains tightly compressed below the 9-day Exponential Moving Average (EMA). At the same time, the Stochastic Relative Strength Index (SRSI) lines are descending sharply toward the 50 level of the indicator.
Uniswap Price Prediction: Headwinds Maintain a Firm Foothold
Price activity in the Uniswap market has retraced moderately lower over the last three sessions. While the most recent price candle suggests that bearish pressure may have met temporary resistance, the SRSI indicator does not yet confirm a meaningful reversal, given the limited strength of the rejection.
As a result, UNI continues to trade below the 9-day EMA, and the SRSI lines still strongly suggest that bears are likely to remain in control.
Uniswap Price Prediction: UNI/USDT Bulls Strain to Avert Bearish Dominance (4-Hour Chart)
The 4-hour Uniswap chart shows that bullish forces remain active and are attempting to shift market momentum. The last three price candles are green, with the most recent appearing more pronounced than the previous two.
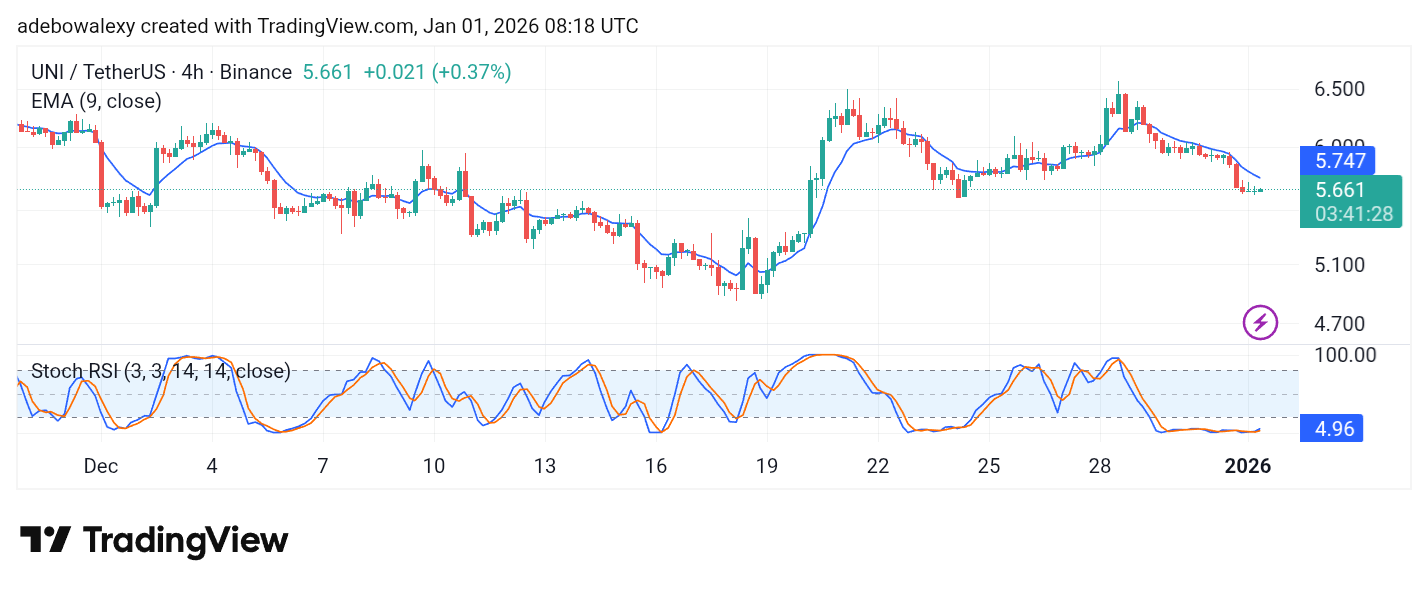
However, this has largely kept price action locked within a consolidation range.
Meanwhile, the SRSI lines are positioned in the oversold region and have begun to lift slightly toward the 10 level of the indicator. Nevertheless, the market may still drift toward the $5.20 price level before any sustained recovery attempt takes shape.