Uniswap (UNI) Price Prediction: UNI/USDT Retreats Below the $6.00 Mark
Estimated Reading Time: 3 minutes
Don’t invest unless you’re prepared to lose all the money you invest. This is a high-risk investment and you are unlikely to be protected if something goes wrong. Take 2 minutes to learn more

Date: December 25, 2025
The Uniswap market previously rebounded strongly from support near the $4.00 price level. However, that recovery lacked follow-through, causing price action to retreat once again below the $6.00 threshold.
UNI/USDT Long-Term Trend — Bearish (Daily Chart)
Key Price Levels
Resistance: $6.00, $7.00, $8.00
Support: $5.50, $5.00, $4.50
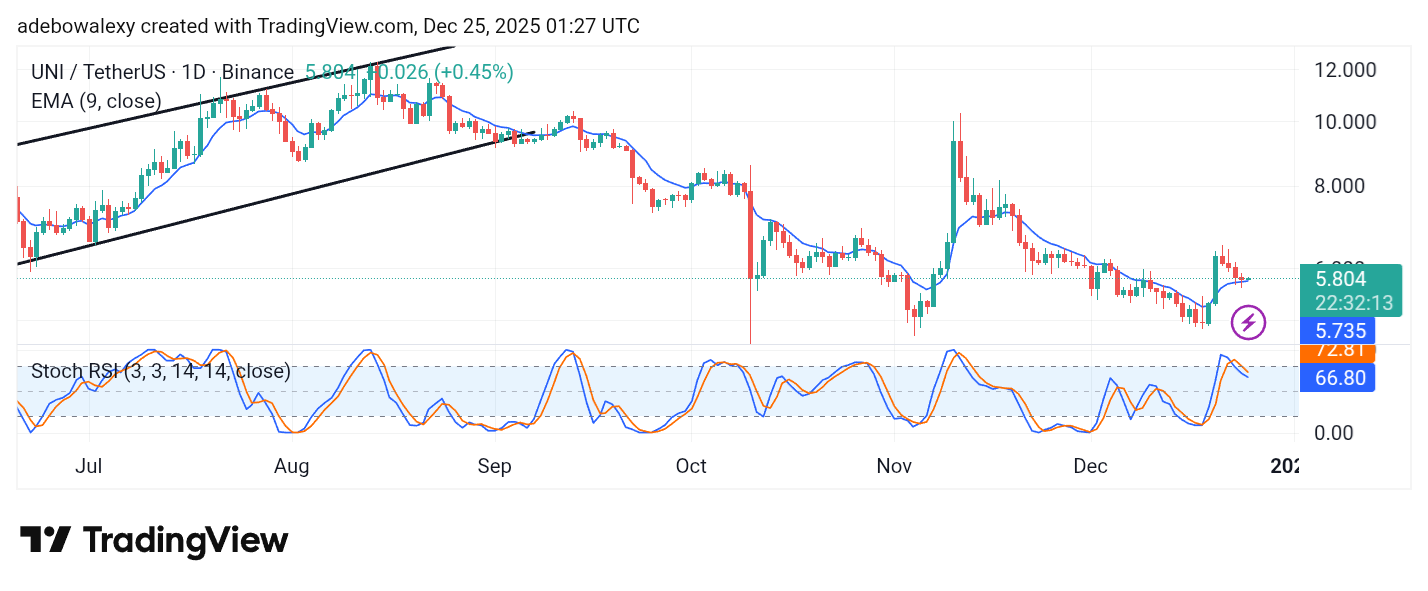
Although Uniswap price action had recently declined toward support near the 9-day Exponential Moving Average (EMA), the ongoing session shows a modest bullish stance. The latest candle is positioned just above the 9-day EMA. Meanwhile, the Stochastic Relative Strength Index (SRSI) indicator lines maintain a generally downward slope, though their endpoints show slight sideways movement, suggesting weakening bearish momentum.
Uniswap Price Prediction: UNI/USDT Buyers Attempt to Hold Ground
At the time of writing, the Uniswap daily chart indicates that buyers are attempting to prevent price action from slipping below the 9-day EMA. The green candle forming just above this moving average suggests renewed buying interest.
However, the SRSI indicator lines continue to trend slightly lower, implying that bullish momentum remains fragile. Traders may want to wait for confirmation, particularly whether price action holds above the 9-day EMA. A sustained break below this level could indicate further downside, while a successful defense may support another upward attempt.
Uniswap Price Prediction: UNI/USDT Maintains a Cautious Bullish Bias (4-Hour Chart)
On the 4-hour chart, UNI is trading marginally above the 9-day EMA. The most recent candle is bullish but appears compressed, with its base dipping below the EMA while the close finishes just above it.
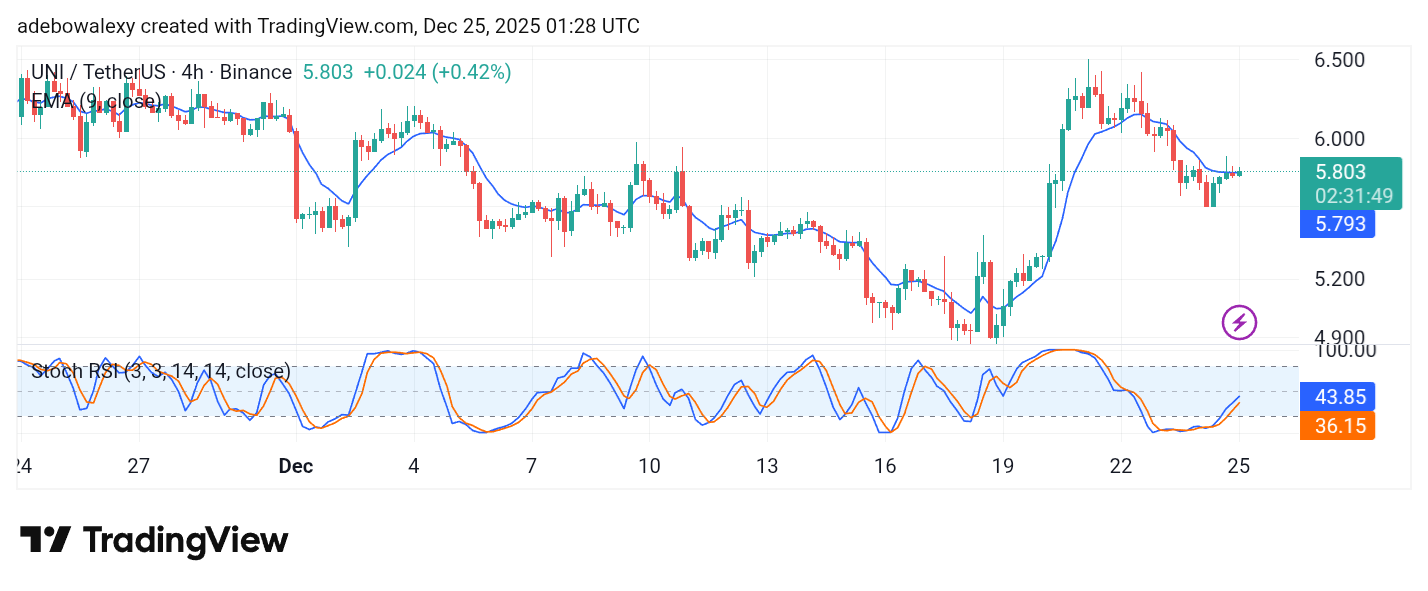
This reflects hesitation among market participants. Meanwhile, the SRSI indicator lines continue to slope upward, supporting a short-term bullish bias. Despite the mixed signals, technical indicators suggest that upside forces could still attempt to push the market toward the $6.00 resistance level in the near term.
Get Uniswap (UNI) here. Buy UNI
Uniswap (UNI) Price Prediction: Headwinds Continue to Drive the UNI/USDT Market